
Key Insights
- LINK is currently trading at approximately $12.56, which is near the top of the descending channel. This may indicate a potential for short-term bullish movement.
- If LINK breaks through the resistance level of $12.70, it could move up toward the resistance of $15.20, based on strong volume and momentum indicators.
- The RSI is currently at 50.61, and the MACD histogram is beginning to trend positive. Both of these indicators suggest that LINK is beginning to enter into a bullish phase.
Chainlink (LINK) Eyes Potential Upside After Forming Descending Channel
As of this writing, Chainlink’s trading price is $12.56, a minor increase, due to the market’s volatility over the past few months; however, the price is forming a short-term corrective pattern, which has left traders feeling somewhat hesitant while continuing to keep an eye out for potential moves upwards. LINK is currently moving toward a major resistance area, and if it does break through that level, it could dictate the price of LINK for an extended period of time.
Descending Channel and Breakout Prospects
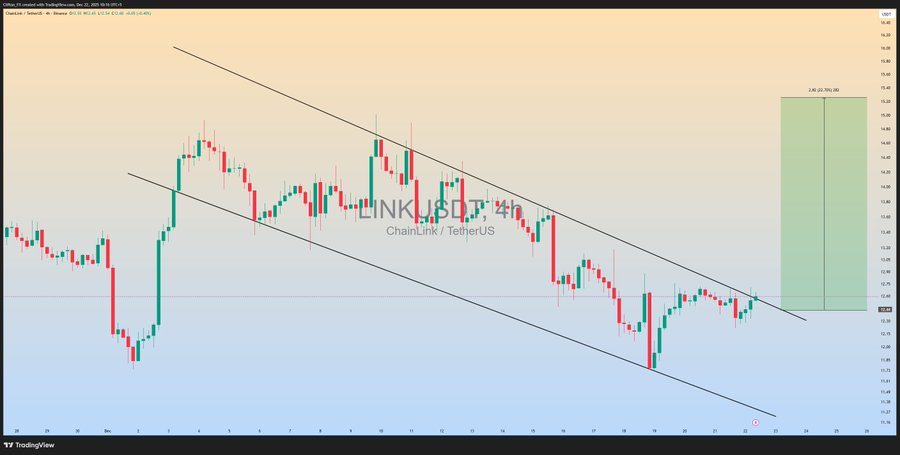
Clifton Fx tweeted that LINK created a descending channel on the 4H (four-hour) chart. The upper trend line is connecting lower highs, and the lower trend line is connecting lower lows, indicating that LINK continues to trend downwards in the short term.
At the moment, LINK is making its way towards an upper channel boundary of between $12.60-$12.70, which is considered a major breakout point.
Clifton stated that if a momentum candle closes above this area, this would initiate a bullish trend. If LINK breaks out successfully, the price may run up to approximately $15.20 with a potential increase of about 25%-30% if it continues at current levels. Traders are waiting to see if they will have confirmation of this trend change through increased buying activity.
 Source: X
Support and Resistance Levels
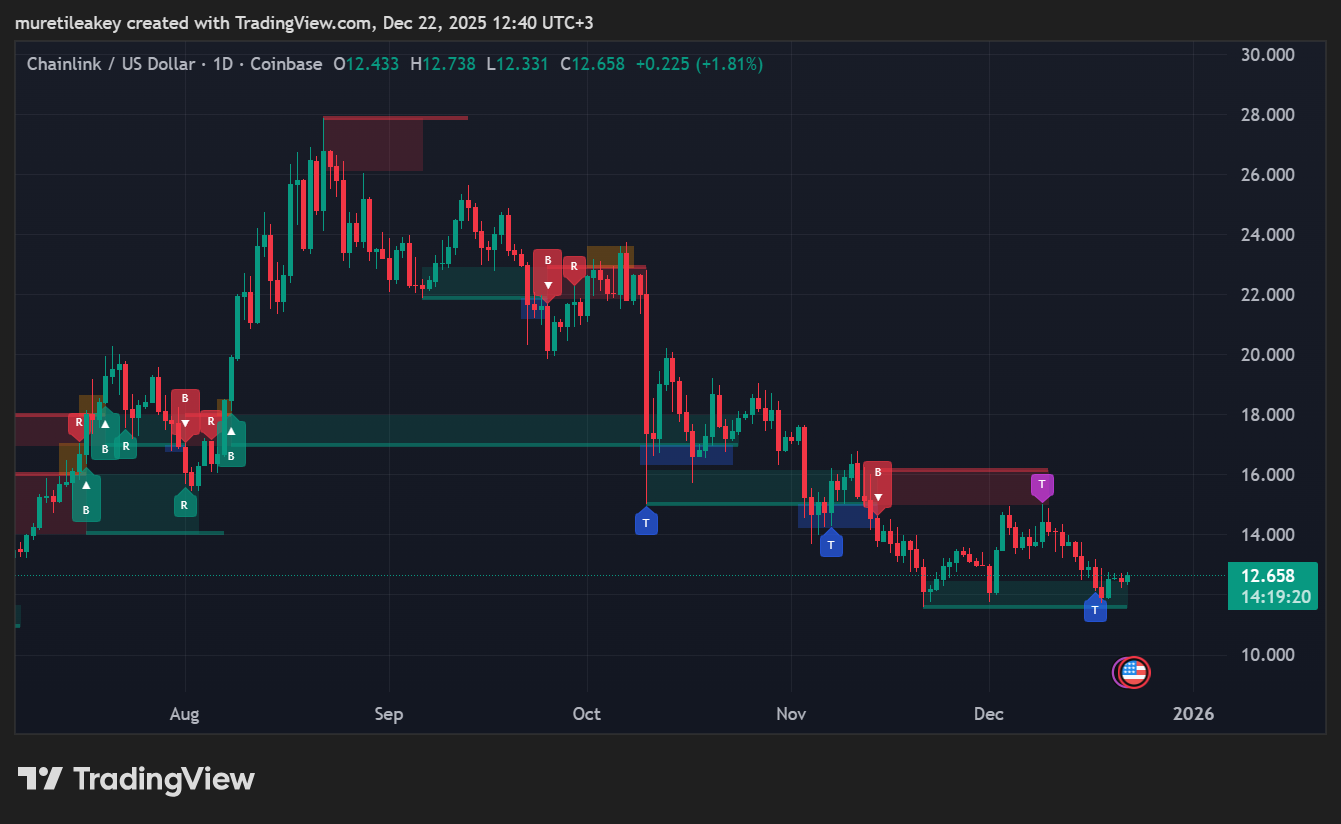
The 1-day LINK chart indicates that the LINK has temporary support areas from $12.45 – $12.50 on the day where it had momentary support after it made a V-shaped recovery off $12.25.
The support level at $12.50 – $12.70 is the pivot level where any bullish trend could be developed. If LINK cannot break through resistance higher than this price point, the lower boundary of the channel, which is the $11.70 – $11.80 area, will still offer excellent support.
There is immediate resistance at $12.60 – $12.65, with the $12.70 – $12.75 area serving as an intraday rejection zone. If LINK manages to break through resistance above $12.70, it could lead to further upside potential targeting $13.50, followed by $14.20 – $15.20 levels.
If LINK fails to maintain the support level, it could lead to a retest at $12.25 or below that, down to the $12.00 level.
 Source: TradingView
Momentum Indicators and Market Behaviour
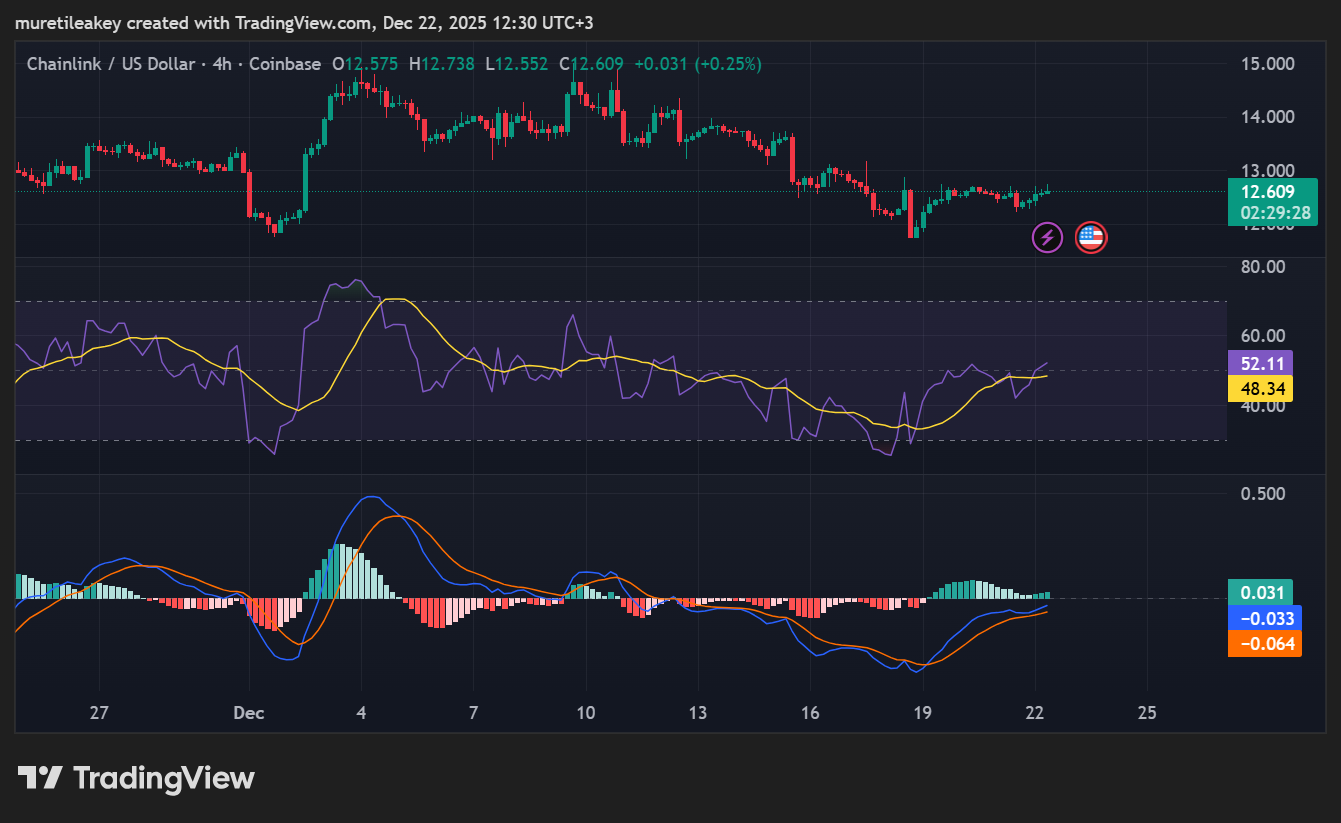
At present, the Relative Strength Index (RSI) is recorded at 50.61, which is higher than its 48.23 moving average. The RSI indicates an area of neutral momentum, with developing bullish momentum recovery. Currently, the MACD histogram displays +0.028 with the MACD line approaching the signal line, signalling the start of a positive momentum trend.
As the short-term trend has been in a corrective phase, both the RSI and MACD indicators suggest that we are entering a phase of stabilization. That means that until we see a breakout, we can continue to see a sideways trading pattern.
If the momentum continues to increase, the existing downtrend will likely continue, or we may see an increase in bullish prices.
 Source: TradingView
Future Price Projections and Market Positioning
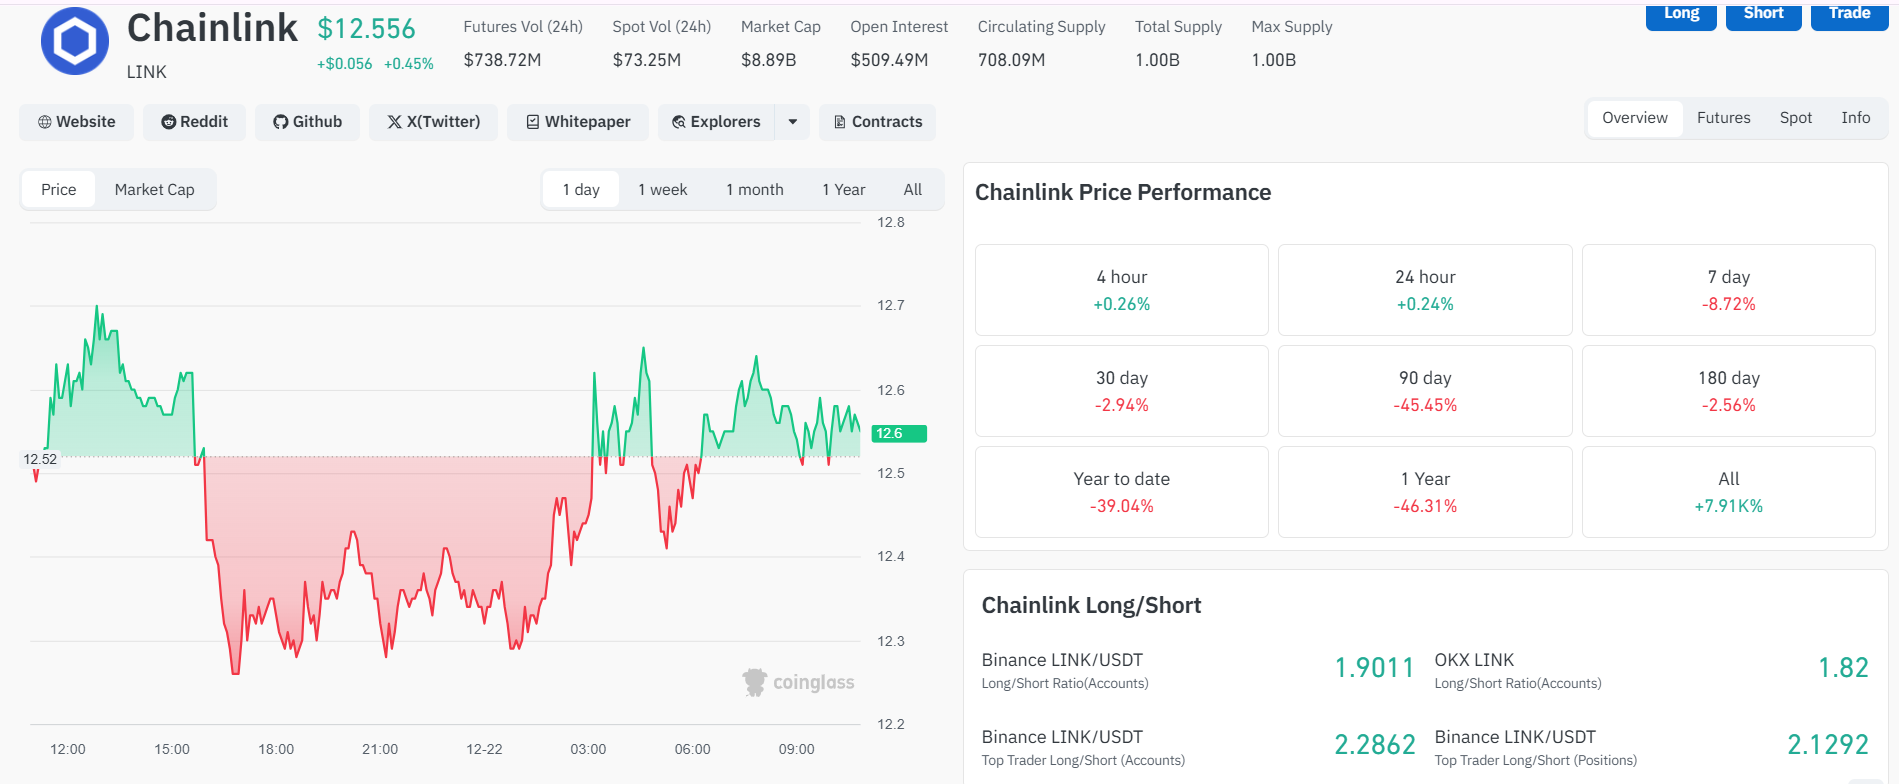
CoinGlass data collected from futures and derivatives indicate that LINK has displayed heavy Long position buying, as shown by a high ratio of 1.90 on the Binance LINK/USDT pair and typically higher than 2.0 on top trader positions. This indicates a very strong bet by the traders in the marketplace that the LINK price will continue to rise, along the lines of the anticipated breakout.
If LINK can confirm a close above the $12.70 close with sufficient momentum behind it, the target could be $13.50, $14.20 and $15.20. Alternatively, if LINK cannot close above the upper trendline of its descending channel, LINK will continue to trade in a tight range within the descending channel.
Source: Coinglass
Final Thoughts
The way LINK is establishing itself now offers a good reference point for traders. For instance, if LINK breaks $12.70, it may experience a temporary rally.
if LINK fails to hold above $12.45-$12.50, it will likely decline to these levels. Many traders will evaluate LINK’s price actions and utilize momentum indicators, such as volume and prices, to determine which direction LINK’s price will take next.