Key Insights
- The price performance based on the 30-day annualized revenue for HYPE
- The price stabilized around $25 support after breaching $31, indicating a probable short-term recovery for $28-$30.
- There are signs of early momentum compression in the technicals, with MACD and RSI indicating potential relief rallies.
HYPE Price Prediction Shows Downtrend Amid Weakening Momentum
Hyperliquid (HYPE) is currently in a bear market trend after touching $55-$58. The current market trend seems to stabilize around $26, which is above the $25 support level. There have been minor recovery attempts. There are lower highs and lower lows in this market.
Rounding Top Formation and Key Support Levels
According to Ali Charts, there is a possibility that HYPE is establishing a rounding top as accumulation changes to distribution. After rising from $16-$18 early in the summer up to a peak of $43-$45 in October, HYPE began to gradually lose momentum on its way upward.
Recently, there was an important horizontal support level at $31 that was broken, confirming that HYPE is now in the process of trending downwards. The top break below $31 indicates that buyers are no longer in control of this market.
The current price has fallen to $25.2; therefore, the price is below the old horizontal support level, which is now an area of resistance for HYPE. There may be some short-term relief at $21, but eventually the price should reverse to $16 to complete the rounding-top formation.
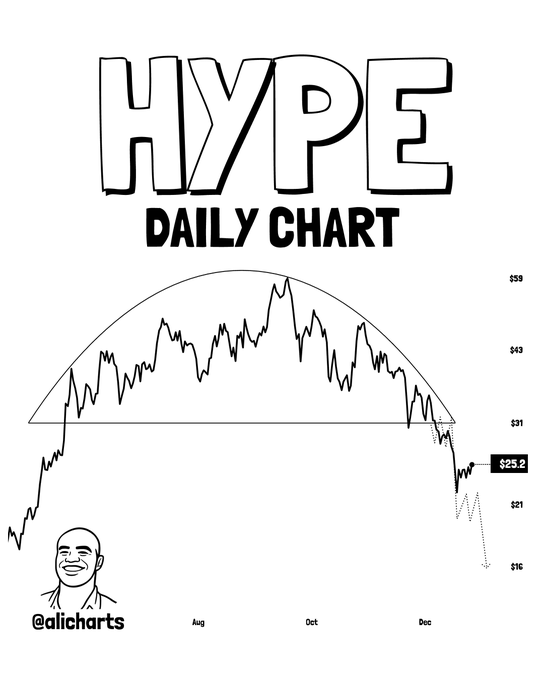
Source; @ALICHARTS
Hype Price Prediction: Correlation With Revenue Trends
According to KookCapital, the price of HYPE (HYPEN) has closely tracked its 30-day annualized revenue trends. The price increased from $18-20 to $35-38 between March and June, a period when annualized revenue grew from $350M to $700M.
Between June and early September, revenue accelerated further, with peak revenue approaching $1.4B during this period, which was mirrored by HYPE’s price climbing to a peak near $55-$60.
When HYPE’s price dropped, it was also mirroring drops in the amount of revenue produced; therefore, it demonstrates a clear correlation between HYPE’s revenues and its share price.
Starting in late September, revenue dropped from the base of $1.2B to approximately $700M; at this point in time, HYPE’s price reflected the same decline, meaning that there was no bullish divergence.
Current levels of revenue support for HYPE are approximately between $650M and $700M in annualized revenue; therefore, the current price level of HYPE supports levels higher than $25, with secondary support at $20. Additionally, there will be price resistance at $45, and without revenue growth above $900M – $1B, future price gains will likely not be sustainable.
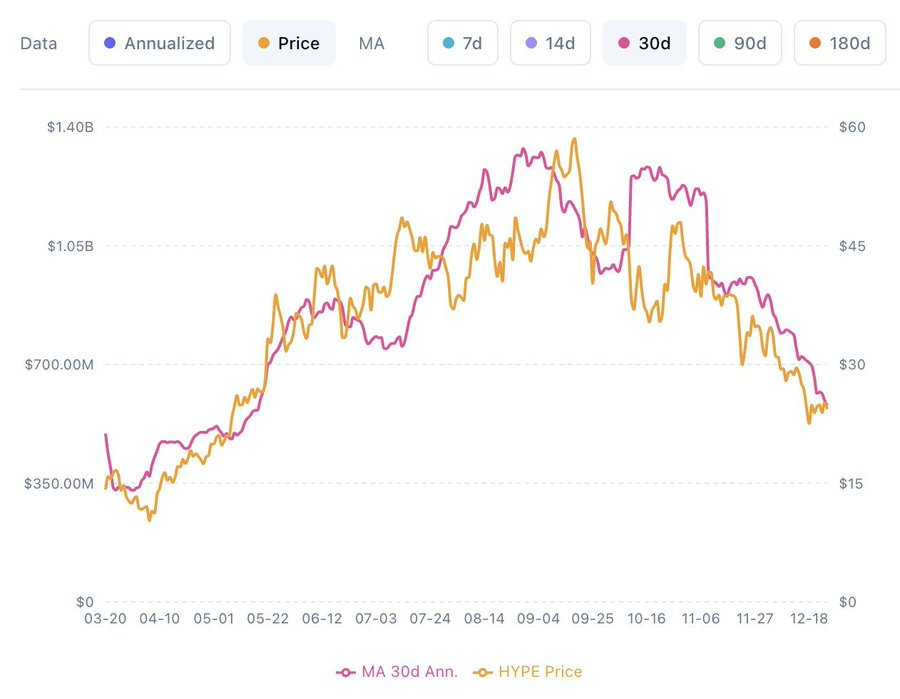
Source: X
Technical Indicators
The daily chart indicates a Downtrend in HYPE according to the MACD, which is at -2.04 and is trying to curl upwards to meet the Signal Line. The histogram has crossed into positive territory, which indicates that there is early-momentum compression happening.
Currently, the RSI is around 43.95 and appears to be in recovery from an oversold condition, while it remains below 50 for bullish momentum confirmation.
To summarize, these metrics suggest that although the selling pressure has weakened, more bullish momentum will be necessary for RSI values above 50 to sustain a long-term upward trend. Overall, the general market trend is still leaning toward bearishness; there may be rebounds in the short term.
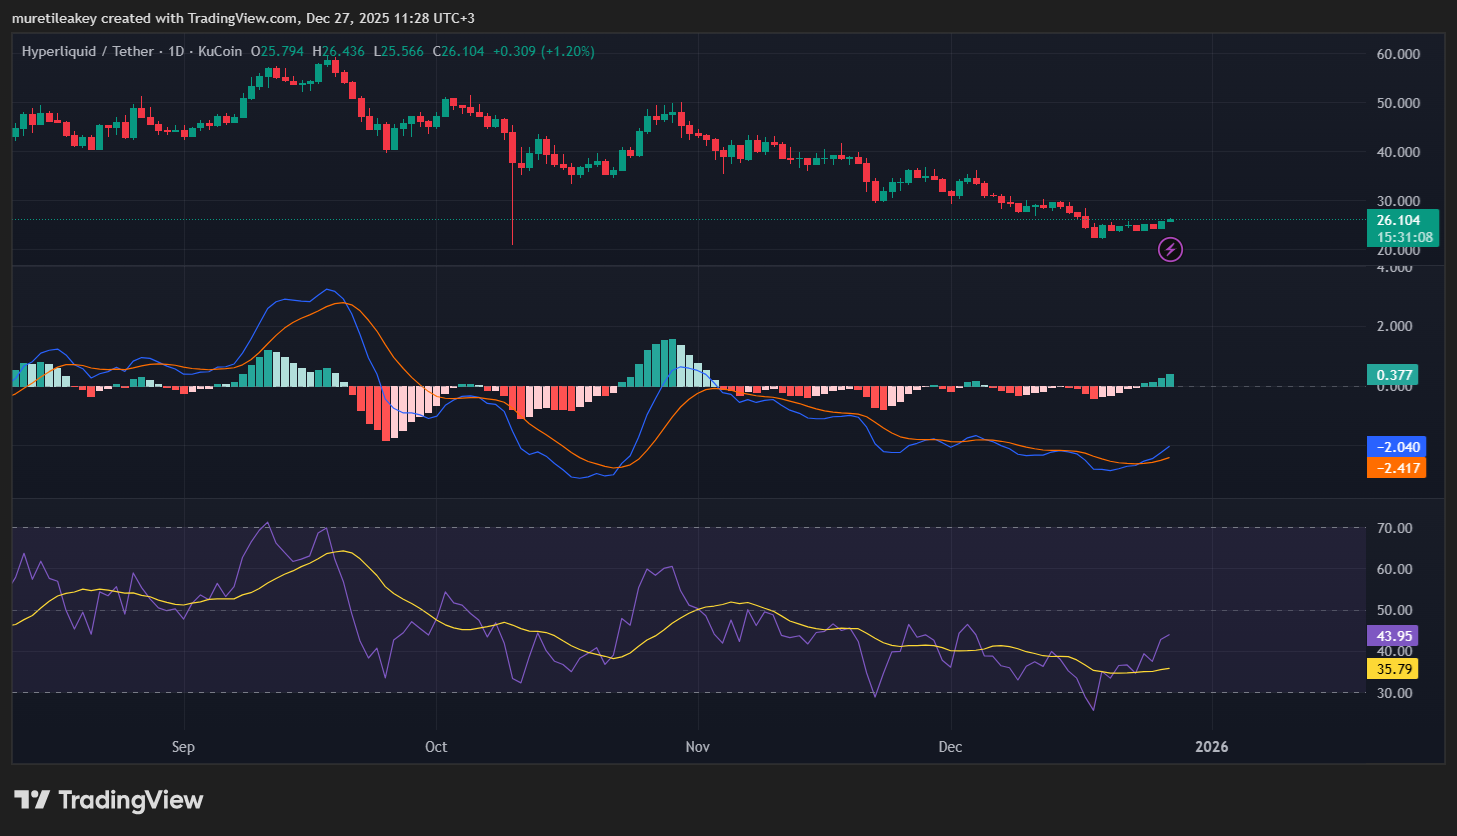 Source: TradingView
Market Structure
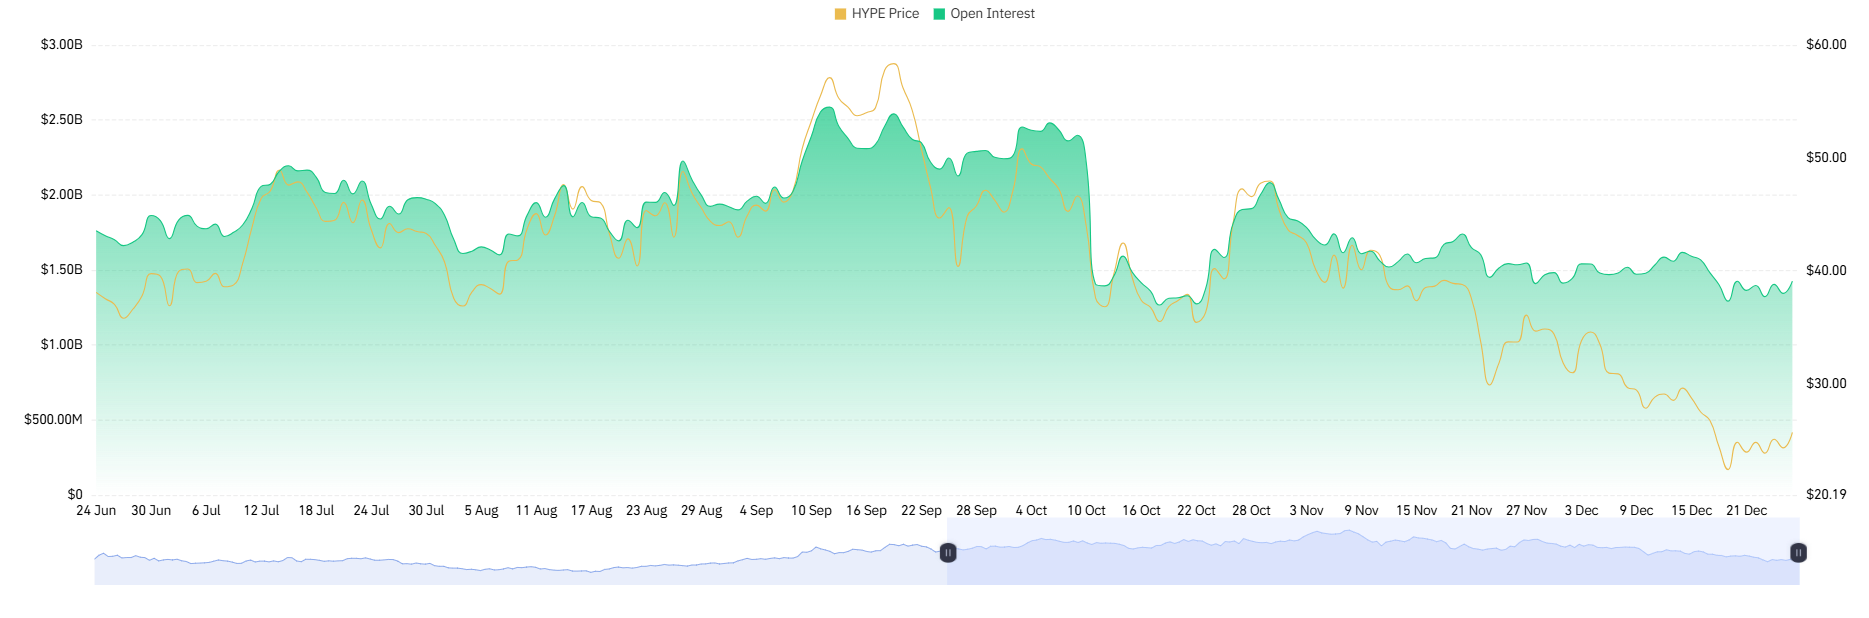
The analysis of the open interest shows that the accumulation led to a rapid rise in the number of contracts that were purchased on margin, followed by a very fast deleveraging. The current lateral action of price is weakly recovering, exhibiting low conviction in price rises due to the continued decline in open interest, and is showing signs of returning to a corrective phase rather than a reversal phase.
When viewing the daily, we can see that the pattern of lower highs and lower lows continues. If we break through the $25 support zone, we could see further declines down to the near-term support zones of between $22-$20.
If HYPE recovers back to the former highs of $28-$30, we can expect major resistance to that price action coming from these once-trending areas as they now serve as overhead resistance.
 Source: Coinglass
Forward Outlook and Potential Scenarios
The short-term price prediction for HYPE indicates a possible bounce back towards $28-$30, assuming that the $25 support is maintained. However, should HYPE be unable to stay above the $25 level, we could see a further drop into the range of $22-$20, in line with historical lows on revenue.
To keep HYPE moving upward, it will be critical to increase its revenue to levels above $900M to $1B. If this does not happen, HYPE’s price will likely continue to decline along the same path as its fundamentals do at this time.
Final Verdict
The price of HYPE is based on its fundamental characteristics and is affected by its revenue. Currently, the technical indicators suggest that HYPE is losing momentum, along with its market structure showing an overall bearish outlook.
Although short-term rebounds may occur, longer-term trend reversals will hinge on significantly higher revenue growth. Observing support levels $25 and tracking revenue will help predict when these trend changes may happen.
FAQs – HYPE Price Prediction
Q1: What is the current HYPE price prediction?
HYPE price prediction suggests potential short-term relief toward $28–$30, with key support near $25.
Q2: What are the key support and resistance levels for HYPE?
Support levels are $25 and $22–$20, while resistance exists at $28–$30 and $31.
Q3: How does HYPE price relate to revenue trends?
HYPE price closely tracks its 30-day annualized revenue, showing a strong correlation between fundamentals and price movement.
Q4: What technical indicators are showing for HYPE?
MACD and RSI indicate momentum compression and minor relief rallies, while Open Interest suggests weak recovery.
Q5: Could HYPE fall below $25 support?
If $25 fails, HYPE price could drop toward $22–$20, aligning with historical demand zones and prior revenue floors.