Key Insights
- HBAR price trades within a defined range as institutional ETF accumulation continues near cycle support levels.
- Regulatory clarity keeps volatility contained, allowing prices to respect technical support and resistance zones.
- The market structure reflects absorption, with $0.11 support and $0.15 resistance guiding near-term price direction.
The HBAR price movement is currently near its recent low; therefore, accumulation by institutional investors and regulatory clarity are fundamental to the way the market has formed. Recent ETFs and legislative updates provide clarity on the reason for the current price consolidation of HBAR and offer opportunities for determining potential price direction in the future.
HBAR Price Structure and Current Market Position
The HBAR cryptocurrency has been in a narrow trading range since it reached its all-time high last summer. The continued price decline, coupled with the price consolidation at these lower levels, suggests that the selling pressure has decreased but not completely disappeared.
According to FinancialPress, there has been an increase in HBAR ETF holdings by Canary Capital by around 492 million tokens. This accumulation took place while the HBAR price was trading near its support level and not during any rallying attempts.
From a pricing standpoint, this type of accumulation can be construed more as an absorption phase and not a distribution phase. Therefore, it appears that larger buyers are willing to continue to purchase without exerting much influence on the market price.
From a technical standpoint, the price of HBAR has begun to stabilize within the range of approximately $0.11 to $0.13. This range can be viewed as a short-term balancing area after a much larger price decline in HBAR.
Regulatory Context and Its Role in Price Stability
According to information provided by Bmendo, Hedera has been classified as a non-security under new U.S. Senate legislation. Thus allowing HBAR to be included in regulated ETF products.
Generally speaking, prices of assets whose regulations have been established tend to remove uncertainty and therefore “reduce” the volatility that can occur due to a lack of regulatory clarity. Such assets will typically have a clearer pattern of support and resistance levels.
However, HBAR’s recent price action following the most recent announcement did not show a strong rise on the news, which supports continuing consolidation of the asset.
According to Price Analysis of HBAR, the asset is currently being influenced by structural support and resistance levels versus the uncertainty of regulatory risk.
Supply Structure and Its Influence on Price Consolidation
Hedera’s fixed 50 billion supply plays a central role in current price behavior. As regulated products continue absorbing tokens, the circulating supply becomes less flexible.
ETF-based accumulation removes tokens from active trading circulation. This process often contributes to tighter price ranges and reduced volatility during accumulation periods.
HBAR has remained within a narrow band despite broader market fluctuations. This behavior aligns with gradual absorption rather than aggressive speculative positioning.
HBAR price analysis indicates that sustained consolidation near support often acts as a preparation phase. Directional expansion typically follows once the supply-demand balance shifts.
Key Price Levels to Watch
The current support is approximately $0.11, and it has been providing support throughout the recent consolidation period. The larger support area is at around $0.10. This is considered to be both a psychological level and a structural support level.
The closest area of resistance is at approximately $0.13. The market has repeatedly stalled at this price point and, therefore, has provided resistance to the price. The broader area of resistance for this price range can be found at $0.15, which previously provided support for the price.
These important support and resistance levels will dictate the next direction for the market. The volume and follow-through price action will determine if the price will move out of the range or remain within a consolidation period.
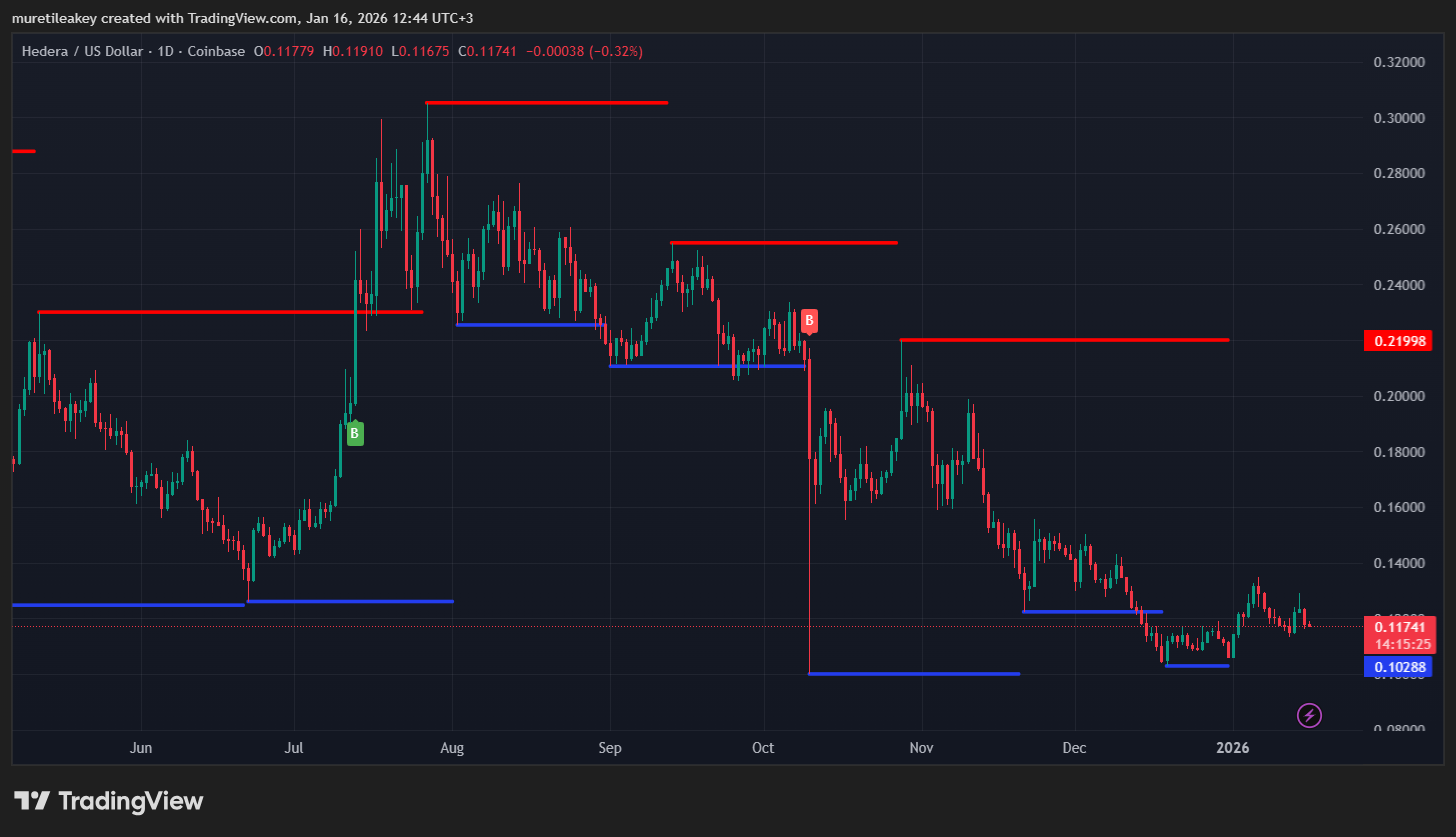 Source: TradingView
What’s Next for HBAR Price: Scenario Outlook
Bullish Scenario: Breakout From Accumulation
In a bullish scenario, HBAR holds at or above $0.11 as demand continues to grow. Without increasing sell pressure, ETF accumulation should remain consistent.
An extended break above $0.13, along with continued daily closings above $0.15, would indicate a change in market structure. In this scenario, HBAR prices may target the $0.18 to $0.22 range.
This process is likely to be gradual and not characterised by rapid price increases. There will be confirmation of this bullish movement through increased volumes and subsequent higher daily closes.
Bearish Scenario: Support Failure and Renewed Weakness
If HBAR trades below the $0.11 support level, then the bearish scenario will develop. A confirmed break below this support will lead to a retest of $0.10.
If HBAR does not maintain its price at $0.10, there is a great possibility that price action will move downward towards previously established demand zones that had weaker tests of support.
If that happens in addition to ETFs accumulating HBAR, selling pressure from the market will most likely increase.
In this environment, the accumulation of HBARs through ETFs would slow down or be outweighed by the broader market’s weakness, causing price action to be reactive rather than progressive.
Neutral Scenario: Extended Sideways Range
Under a neutral situation, HBAR is going to remain bound between lows of $0.11 and highs of $0.13. High supply absorption with limited demand will cause the continued offsetting of each other.
Compressing Volatility until we have confirmation awaits us. This type of pattern often precedes an expanding trend but has little need for immediacy in direction.
Analysis of the HBAR price in this regard means we need to sit back and let the market digest the full supply, without making any firm directional commitment.
Final Thoughts
The analysis of HBAR has indicated that there has been an accumulation over time to correct for the existing weakness in the market. The support level of $0.11 is well established, while resistance levels are also in place at $0.15. The next stage will be determined by whether buyers (demand) or sellers (supply) prevail at these levels.