
Key Insights
- Ethereum saw major exchange inflows and increased liquidity, which created short-term pressure and stabilization as the broader market reacted positively.
- Whale wallets traded near their highest realized price for the fourth time since 2020, historically such happenings are linked to renewed market strength phases.
- Technical charts have revealed a rounded-bottom pattern that is supported by consistent higher lows and a large whale long position and strong engagement.
Ethereum Market Signals continued to attract attention. Traders evaluated inflow spikes, whale activity, and developing chart structures that suggested improving market conditions. Recent on-chain and technical readings pointed toward a phase where larger holders appeared increasingly active while sentiment gradually steadied.
Ethereum Whale Inflows Reshape Short-Term Trading Mood
According to a recent exchange, data shared by chartered market analyst Ali charts, it shows that nearly 60,000 ETH, valued at close to $200 million, have been moved onto trading platforms within a single day. This surge created an immediate rise in exchange balances and added short-term pressure to the market.
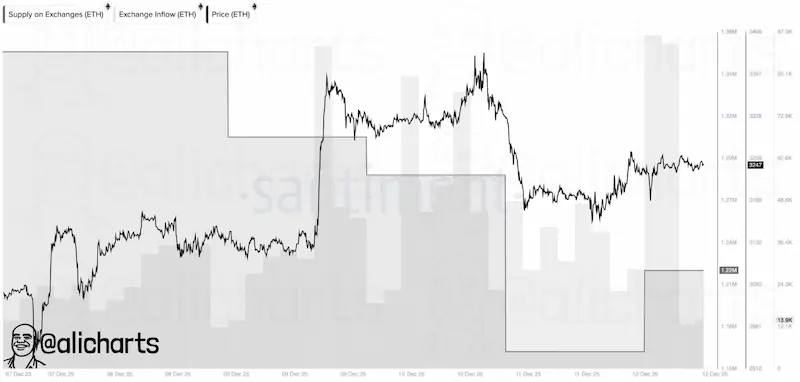 ETH Supply Exchanges / Source: X
Notably, price reacted quickly, and fell, this occurrence shows that traders interpreted the move as a shift toward an active positioning. Before the transfers, ETH had been climbing steadily, however, the sudden change in liquidity introduced new volatility across order books.
Eventually, the market stabilized and participants are currently observing to see whether the inflows will reflect into direct selling or will it cause temporary repositioning. Many have continued monitoring these outflows to determine if the activity will eventually evolve into a lasting trend. Or will it remain a brief liquidity adjustment.
Whale Cost Basis Interaction Gains Market Focus
Cryptorands’ post on social platform X added more bullish sentiments. The analyst noted that ETH is being traded near the realized price of wallets holding more than 100,000 coins. This is a rare event that has appeared only four times since 2020.
The previous occurrences were aligned with periods when whales traded near their cost basis during broad market resets. Each of the past instances preceded durable recovery phases as larger holders maintained steady positioning and as volatility compressed.
Notably the current conditions are showing a rise in whale balances as price makes a return to this key support level. This combination of renewed accumulation and a return to the realized cost zone has drawn interest from analysts. Most are seeing this setup as a structure that forms during earlier stages of long-term market strengthening.
Ethereum Technical Recovery Shows a Strengthening Base
Price charts are showing that ETH is forming a rounded-bottom structure on the four-hour chart. This pattern has developed and has extended all the way from the late-November low and has continued producing higher lows. This steady momentum signals the presence of consistent demand and absorption.
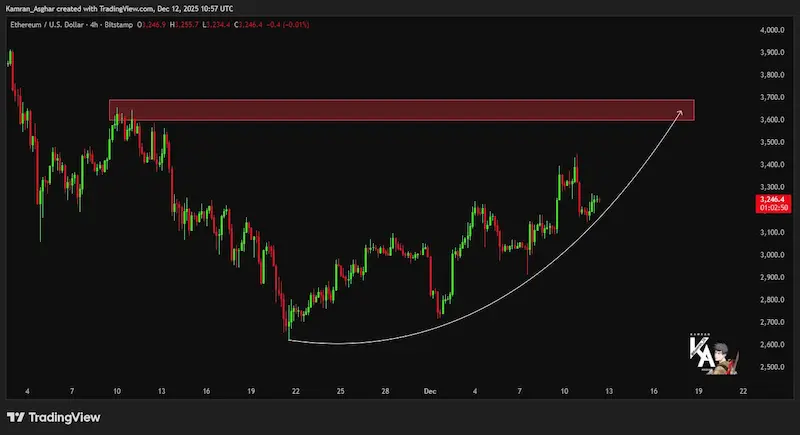 ETHUSDT Price Chart / Source: X
As of this writing ETH is being traded near $3,240–$3,260,after an extended consolidation along the curve. The price is approaching the next major test at $3,600–$3,700. That region acted as a strong resistance in the past which is making it a critical checkpoint for assessing the levels of market conviction.
Additionally,a large long position of about $490 million added further attention. The whale’s stance indicates its firm commitment during this period of stabilizing price action. Whale positions in the market does not always solely determine direction. However its scale suggests there is strong engagement from major traders as the market continues developing its mid-term bullish structure.