
Key Insights
- Bitcoin’s price is higher compared to past bull cycles and illustrates a longer-term estimated bullish trajectory through institutional accumulation and previous periods of consolidation.
- Technical Indicators represent shorter-term stabilisation, and n a potential area for market correction with the opportunity for the market to rebuild momentum into 2026.
- With Policies changing and expectations for liquidity being positive, create a higher level of market confidence that will likely lead to a Stable Structural Recovery.
BTC 2026 Price Prediction: Will Historical Patterns and Accumulation Signal Recovery?
Following new all-time highs in 2025, Bitcoin has moved away from those record levels and is now entering a period of cooling before we can see the longer-term direction. Going forward, historical performance, institutional accumulation trends, policies, and technical market positioning will dictate investors’ expectations for how Bitcoin will likely trade moving into 2026.
Yearly Structure and Historical Context
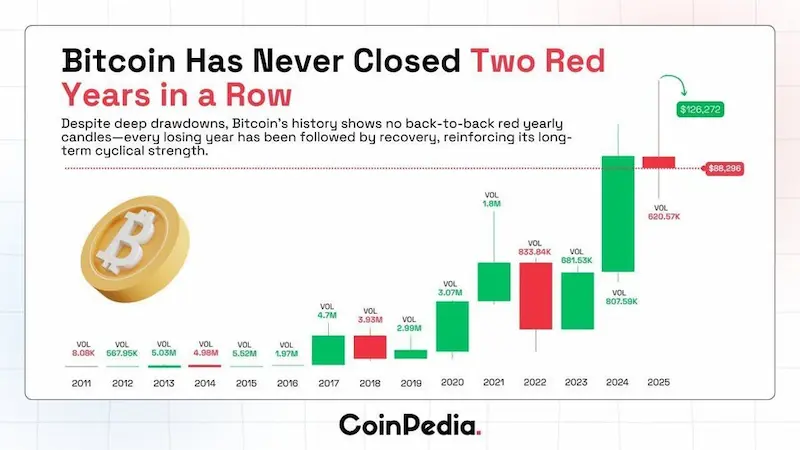
Bitcoin has continued to maintain a long-term historical pattern on the chart. Including the 2021 closing, the asset has never had two consecutive years with negative annual candles since it was created. This pattern has stayed valid even through significant drawdowns, regulatory disruption, and extended weak sentiment.
A recent post from CryptosRus brought attention to the significance of annual candles in eliminating short-term noise. The 2025 candle is not finished yet, so the historical patterns are still applicable. In prior cycles, many of the same reset periods that we are experiencing now were generally followed by price increases; they did not signal the end of the cycle.
Source X CryptosRus
From a structural point of view, Bitcoin is still positioned above past cycle highs, and this has historically supported higher long-term valuations, even during corrective periods. Yearly volume decrease has also indicated a growing and maturing market as opposed to a decline in participation.
2025 Price Action and Technical Signals
The year 2025 saw Bitcoin go through a classic expansion and contraction pattern. Starting in the early months of the year, Bitcoin’s price dropped to about $80,000 and then moved steadily up until the summer months, peaking around $126,000 before coming down again by the end of the calendar year.
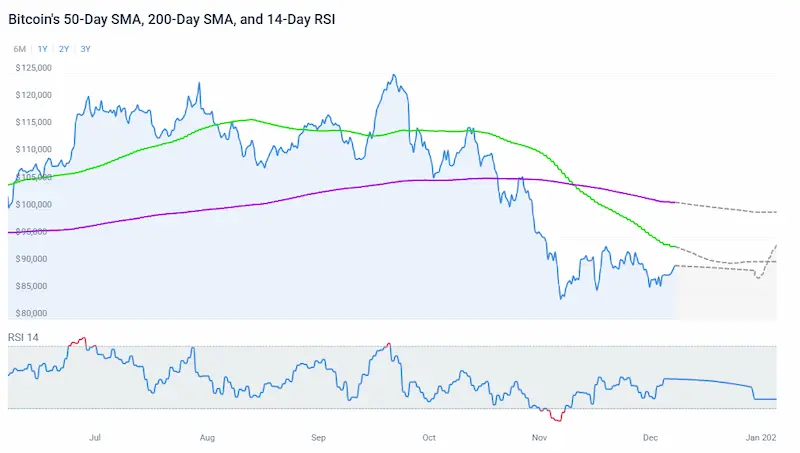
Technical indicators show price momentum slowing down instead of breaking down. The Relative Strength Index (RSI) has dropped back into the market from overbought territory, but did not crash, which would indicate a breakdown.
In addition, trading volume during the price drop was decreasing, indicating that the price action is more likely a sign of taking profits than widespread panic selling.
There is still downward pressure from the short-term trend. The creation of a “death cross” occurred in November. The 50-day moving average crossed below the 200-day moving average.
Historically, many periods of strong performance within a larger uptrend have seen similar conditions before an extended period of consolidation rather than before any significant bearish period.
Source: Coincodex
Institutional Accumulation and Supply Conditions
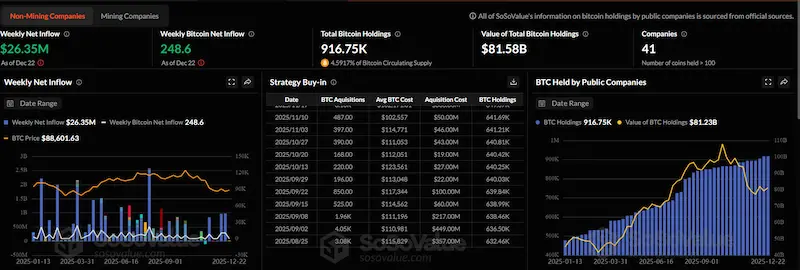
Sosovalue Data tracking non-mining public companies shows continued accumulation of Bitcoin throughout 2025, with positive weekly net inflows, even while BTC price action traded near Cycle Highs. Corporate treasuries collectively now hold over 900k BTC.
Regular corporate purchases at higher-than-market price levels demonstrate sustained holdings, and their market value has fluctuated with BTC price fluctuations, suggesting that buying at these levels represents long-term reserve holding as opposed to short-term speculation.
When a large portion of the supply is in long-term custody, it reduces the amount of BTC available for trading on a liquid market. Although an increased concentration of ownership can increase price volatility.
 Source; Sosovalue
Policy Signals and Liquidity Backdrop
A secondary layer was added to the late-2025 market narratives through commentary provided on policy. According to a statement cited by CryptosRus and attributed to former United States President Donald Trump, the US would not again sell its Bitcoin holdings. The statement was in opposition to the government’s previous sales of Bitcoin in the past that were deemed unsuccessful later on in the market.
In addition, shortly after the statement, participants within the cryptocurrency marketplace reacted to news that the Federal Reserve might inject more liquidity into the market in the coming months. It is generally understood that any expectation of lower-than-average levels of liquidity tends to boost risk assets such as Bitcoin.
While many other factors affect how prices move, the sentiment created as a result of these types of policy and liquidity developments will also influence the way that the market reacts to both technical and structural signals at the beginning of a new cycle.
What Comes Next for Bitcoin in 2026
The bitcoin market is not reversing. The price of Bitcoin moves cyclically between its all-time high and local lows, with large institutions and corporations returning to secure, absorb, and accumulate Bitcoins as the market dips during this time.
This last activity is consistent with the bitcoin price chart’s pattern of absorption during stretched-out price consolidation periods leading up to significant price increases.
The $80,000-$85,000 area is a significant reference area for structural support; remaining above this area allows for future price ranges to develop as momentum is rebuilt over time. A sustained recovery above $110,000 suggests that market conditions are strengthening.
Following last year’s correction that maintained bitcoin’s bullish structure over time, bitcoin now enters 2026 with a return to consolidation around the $80,000-$85,000 zone; through consolidating near this zone, bitcoin may be poised for the next round of price movement upward toward $110,000-$126,000 within 2026.