- XRP price has stayed at $1 due to the lack of momentum and volume in the 4-hour chart.
- The XRP is below important moving averages, with inflow from ETF and whale transactions still happening at $1 support level.
- The support for XRP is seen at $0.99, with resistance at $1.01.
XRP price action remains under pressure near the $1.00 level as the token continues to trade below key moving averages on the four-hour chart. The price of XRP was seen fluctuating within the $1.0034 and $1.0038 range after falling from the $1.08 area, where its 24 hour performance was seen down by 0.77%.
The volume also witnessed a decline by 15.59%, suggesting low levels of activity witnessed during the recent session, while inflows to U.S. listed spot XRP ETFs were positive.
XRP Price Meets Resistance Despite Weak Momentum
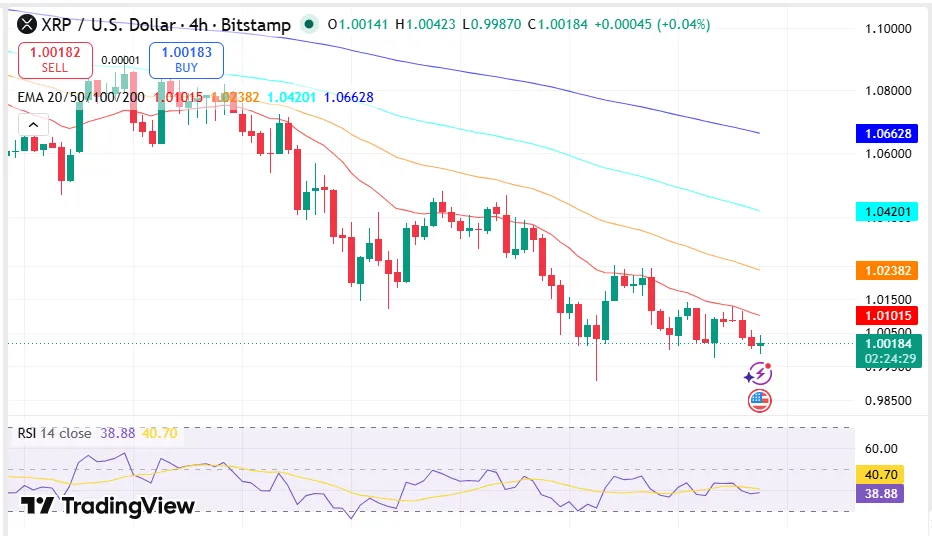
The technical outlook on the four-hour chart suggests bearish sentiments for XRP, as it was trading below a number of moving averages. While the 20 EMA was placed at $1.0113, the 50 EMA was found at $1.0249. The 100 EMA is at $1.0429, and the 200 EMA is at $1.0670. Another chart reading places the 20-period SMA near $1.0098.
Source: Trading View
The moving averages create several resistance levels above the current price. XRP has also faced repeated rejection around $1.03 after failing to sustain higher levels. Resistance identified on the chart extends toward $1.0480, while the $1.0098-$1.0225 zone represents the nearer resistance area.
Support remains concentrated around the $1.00 level. Fibonacci levels identify $0.9970 as immediate support, followed by $0.9902, while another chart reading places support at $0.9905. A move below $0.99 would put XRP beneath the current consolidation range.
The RSI on the 4-hour chart currently is at 40.26 and is below the neutral 50 mark but above oversold levels.
XRP has been in consolidation around $1.00 after the price fell to around $1.08. The contraction of the Bollinger Bands suggests that there has been a contraction in volatility surrounding the current price range.
A break above $1.0098 will see the token above the short-term moving average, whereas a break below $0.9970 will see the lower support levels come into focus.
Trading volume has also declined by 15.59% over 24 hours. The combination of lower volume and consolidation has occurred as XRP remains near the $1.00 support area.
XRP Price Gets Support From ETF and Whale Activity
Institutional demand has remained positive despite the correction. CoinGlass data showed that U.S.-listed spot XRP ETFs recorded $2.25 million in net inflows through Thursday. If Friday also posted a net inflow, the products would complete a fifth consecutive week of positive net flows.
The reported inflows show that ETF investors continued adding exposure while XRP traded near its support zone. However, the weekly flow was relatively modest, and the data did not establish that ETF demand had reversed the broader price trend.
CryptoQuant data showed that large XRP holders have continued building positions. XRP’s average spot order size remained dominated by transactions classified as big-whale activity during the year, including while the token traded within the $1.00-to-$1.20 range.
Large buying activity around current levels shows that significant buying has continued near support. However, XRP’s 90-day taker Cumulative Volume Delta has cooled to a neutral reading. The indicator tracks the difference between aggressive buying and selling in the market over time.
The neutral CVD reading shows that the reported accumulation has not been accompanied by strong aggressive buying. Large holders appear to be adding exposure through transactions that have not produced a decisive shift in taker demand.
Important Levels for XRP and Current Market Structure
At the time of writing, XRP price is trading in a bearish four-hour structure at around $1.00 with negative RSI momentum and reduced volume.
While the fact that the coin is getting interest from ETFs and Large Holders is showing that there is still interest in the coin at its present level, the neutral taker CVD shows that there is currently no buying pressure.
The areas indicated on the chart are as follows:
- First Resistance Zone $1.0098-$1.0113
- Support Zone $0.9970-$0.9902 is the immediate support level.
- $1.0225 and $1.0480 are higher resistance levels in case the buying pressure resumes.
This technical setup depends on whether the price of XRP is able to move above $1.01 or defend the support levels of $0.99. The breakout above $1.0098 will take the price level of XRP above the short-term moving average, while the breakdown below $0.9970
FAQs
Is XRP still below its key moving averages?
Yes. XRP is still trading below the 20 EMA, 50 EMA, 100 EMA, and 200 EMA on the four-hour chart.
What is the key support level for XRP?
Immediate support levels are seen at $0.9970, followed by another support level at $0.99
Are XRP ETFs seeing inflows?
Yes. U.S.-listed spot XRP ETFs recorded $2.25 million in net inflows through Thursday.