

Key Insights
- Bitcoin has bounced off the $75,000 price support level in a strong manner.
- The $78,500 to $79,000 zone aligned with an open CME gap
- A level around $81,400 was holding resistance which was preventing an upward move from taking place.
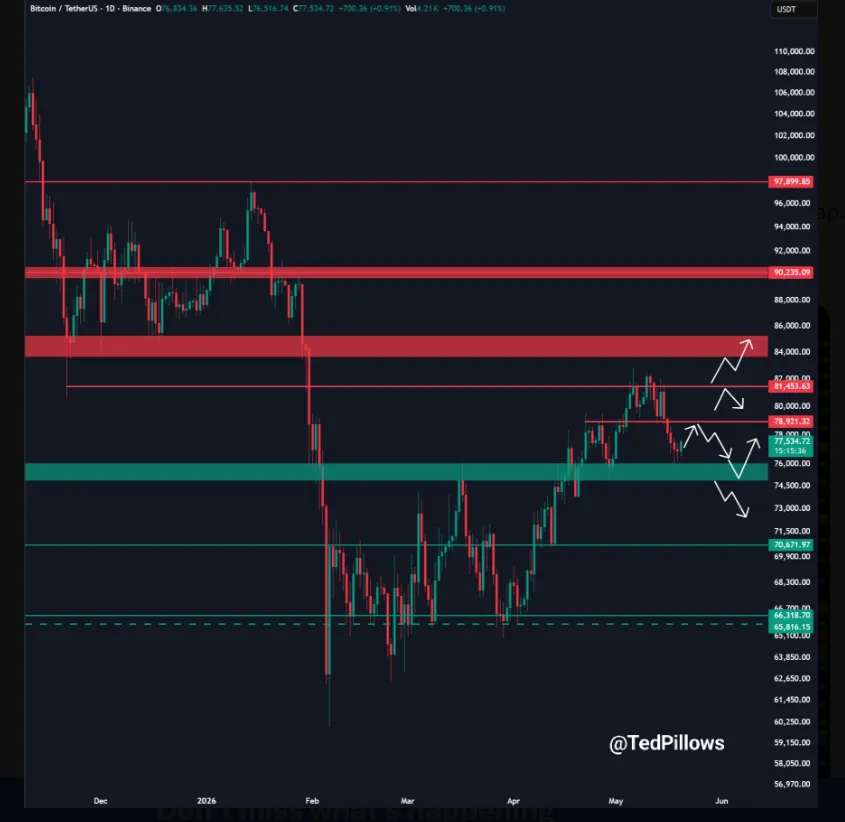
Bitcoin rebounded from the $75,000 to $76,000 support region after a sharp decline from recent highs. The daily chart showed renewed buying activity after price touched the lower green demand zone. Market activity then shifted toward the $78,500 to $79,000 resistance area, where a CME gap remained open.
The chart displayed several major price zones that guided recent market movement. Buyers defended the lower support region while sellers maintained pressure below the $81,400 resistance level. Price action remained compressed between support and resistance as volatility continued across the broader market.
Bitcoin Reclaims Momentum After Testing Lower Support Near $75k
Bitcoin dropped heavily after failing to maintain momentum above the $92,000 region earlier in the year. The chart showed a steep decline toward the $66,000 support level before buyers regained control.
Price later recovered steadily during April and early May. The recovery pushed the market back above the $70,600 level and toward the $78,000 area.
Recent candles showed another rejection below the $81,400 resistance zone. The market then moved lower before stabilizing again near $75,000.
The chart identified the $75,000 to $76,000 region as an active support area. Buyers entered that zone several times during the recent trading sessions.
A projected path on the chart pointed toward the $78,500 to $79,000 region. That area also aligned with an unfilled CME futures gap.
Key levels from the chart
- Support zone stood between $75,000 and $76,000
- Immediate resistance appeared near $78,500 and $79,000
- Stronger resistance remained around $81,453
- Higher resistance stayed near $84,000 and $92,235
- Lower support remained close to $70,671 and $66,318
CME gap near $79K becomes key short-term price magnet for Bitcoin
The current structure placed the market between a defended support area and a nearby resistance cluster. Traders kept an eye on these levels as further confirmation for the next move in direction.
The CME gap around $79,000 added weight as history has shown that price will revisit numerous open futures gaps. During the last sessions, market participants were closely following this level.
Another breakdown below the mid-range structure has been avoided thanks to the rebound from support. Lower areas around $70,600 and $66,300 could have been exposed with a further drop in price.
The short-term momentum was still reliant on the price action near the $79,000 level. The chart displayed the same rejection zones as above the current market.
Market Impact
The recovery from support took pressure off the bears in the market right away. Buyers took an interim lead when they defended the lower demand area.
Trading volume surged at the support level with volatility rising. During recent sessions quick reaction has been seen between support and resistance in the daily chart.
The below $81,400 rejection also kept the bullish continuation tries from picking up steam. During the rebound phase, sellers were still covering upper resistance levels.
Repeated pullbacks were not enough to break the overall recovery structure as price movement stayed within. The market kept making new lows following the April recovery.
Important market observations
- The $75,000 area was defended by the buyers a number of times.
- There was still some resistance at $79,000
- The market rose above the $70,600 level of support.
- The number of days with recovery attempts rose as the volatility on the daily level rose as well.
Analysis
Bitcoin bounced off February lows and traded in a range. The structure gradually improved from the $66,000 zone to higher zones of resistance.
This chart indicated that every move higher was under pressure from sellers near resistance.Buyers still maintained control of the broader recovery structure above key support levels.
Price action near $79,000 remained important because it combined resistance with the CME gap region. That area became the next major test during the current rebound attempt.
The chart also showed stronger resistance zones above current levels. The $84,000 and $92,000 areas marked previous rejection points from earlier trading periods.
Reactions near support and resistance kept holding the momentum in the markets. Short-term, the market was still rotating in the area around the defended $75,000 level and the surrounding CME gap area.
Conclusion
Bitcoin bounced back from the $75,000-$76,000 level following recent selling pressure and reducing the momentum in the market. The rebound brought attention to the $78,500 – $79,000 resistance zone where there was still an open CME gap.
Although the chart has failed to break up and hold the major support area a few times, it has remained in a more wide-ranging recovery pattern above the major support area. Traders kept looking for confirmation of the market direction as price rolled through the CME gap and near resistance areas.