Key Insights:
- Solana is still trapped in a range between $82 and $90 with weak trend.
- Solana has received more than $1B in ETF funds.
- Resistance at $90 limits the price, despite a bit of a bullish tone.
Solana is currently trading with tight volume within a narrow range, and is testing a longer-term downtrend on the three-day chart. A breakout or rejection on the next candle close is likely to signal the next move. Market participants are keeping an eye on that as a breakout might be seen as a trend reversal, while rejection might continue the long-term bearish trend.
Institutional interest remains active. In the past five sessions, Solana has seen $35.17 million in spot ETF inflows, bringing the total investment to over $1.02 billion. The ETFs’ holdings now exceed $1 billion. But not all products are performing well, with TSOL experiencing $102.6 million in outflows. There is also a trend towards lower market activity with lower volatility and volumes. $92 is becoming an important level for any breakout.
Mixed Weak Trend Signals
On the technical side, Solana is currently trading above its short term moving averages (MAs). The MA-20 ($85.10) and MA-50 ($85.78) are providing short-term support, while the MA-200 ($122.01) is well above the current price. The first support is currently found at the Ichimoku Kijun line ($83.72). The moving averages do not have important crossovers, implying no clear trend.
The momentum oscillators are mixed. MACD and the Awesome Oscillator both indicate weak bullish momentum. But the ADX is weak at 9.10, indicating weak trend. RSI is at $51.49, which is neutral to bullish. Other oscillators such as Stochastic RSI and CCI are neutral. Buyers are in slight control, but not committed according to the Bull Bear Power (BBP).
Solana Price Stalls Intraday as it Consolidates Below Breakout Level
On the daily chart, Solana is in a long-term downtrend and has shown recent consolidation between $85 – $87 after a strong sell-off earlier this year. The present horizontal consolidation suggests a balance between buyers and sellers, but the trend is still downward, with lower highs. There is intraday trading resistance at $88 – $90, which has staved off further price gains. The volume has also declined, suggesting a lack of interest and/or conviction at these levels.
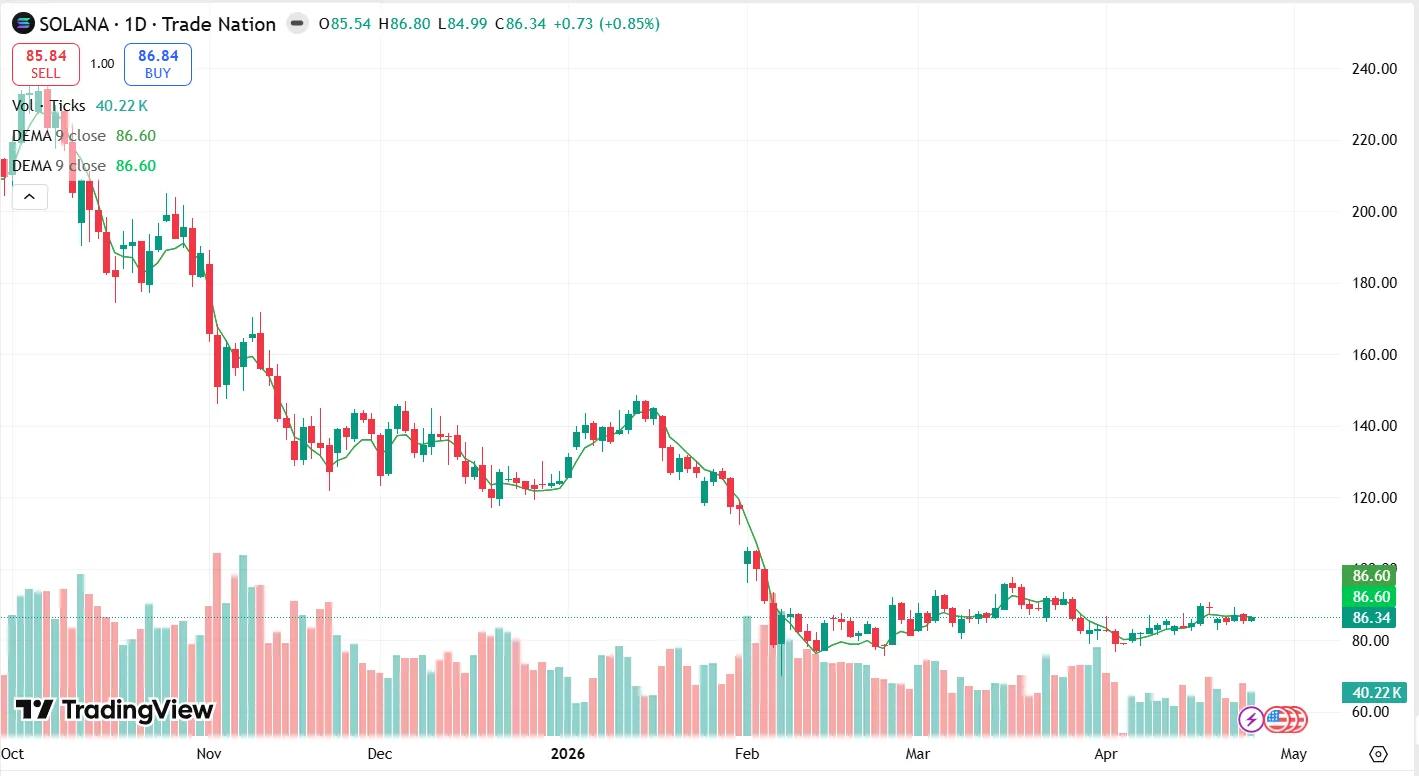
Currently, the market is still following this intraday trading resistance, hence preventing further gains in price. The moving average (DEMA 9) is also providing a dynamic resistance, which is also contributing to the downtrend. For Solana to reverse the trend, we need to see the price close above $90 with sufficient trading volume. In the meantime, we may expect the market to be either in a range or in a minor downtrend because sellers are dominant.
Market Impact: Breakout Risks with Low Volatility and Momentum
The current market environment sees Solana at a pivotal point in a balanced but volatile market, with a narrowing price range and ETF inflows. Institutional demand supports price action but a lack of momentum and daily resistance cap upside. This raises the likelihood of increased short-term volatility. A strong push through $90 could lead to some short-term gains and a renewed buying spree, but a belief that support has been broken may lead to a sell-off.
Therefore, the market may respond to technical factors, with a rapid response to a trend.A convincing break through $90 may trigger short-term gains and a new buying wave, but a conviction that support has been breached could trigger a rush to sell. So, the market is likely to react to technical signals, with a quick response to any trend.
Conclusion
Solana continues to trade within a tight range, despite strong institutional inflows. Conflicting technical indicators and weak trend strength suggest that the trend for a significant uptrend is not in place. Price is struggling to overcome resistance at $90 and short-term support is at $83.72. Solana will probably remain in a range until the trend breaks out or down, and the sentiment is cautious.
FAQs
What is the key resistance for Solana?
The main resistance is $88 to $90 and $92 is a confirmation for a breakout.
What should traders look for in support?
The next levels of support are $83.72, $82-83.
Are Solana ETF inflows a good thing?
Yes but it hasn’t yet driven a major price rise.
Why is Solana not on a run?
A lack of trend and mixed technicals hold it back.
What could make Solana run?
A strong breakout above $90 and on strong volumes could mean a shift in sentiment.