
Key Insights
- Dogecoin continues to defend the $0.135–$0.140 support zone after weeks of corrective price action.
- Price remains capped below the descending trendline, keeping $0.150–$0.155 as near-term resistance.
- Lower open interest levels suggest reduced leverage as Dogecoin trades within a controlled consolidation range.
Dogecoin is trading near a critical technical zone as recent charts show consolidation following a corrective phase. Market participants are monitoring support, resistance, and leverage behavior while short-term momentum eases and broader structure remains undecided.
DOGE Price Analysis Places Daily Chart at a Key Pivot
According to a recent DOGE price analysis, the DOGE price is still below the upper boundary of a consolidation range that has lasted for more than two months.
Currently, DOGE is trading around the $0.143 mark, which is very close to the $0.15 psychological level. Aman recently made a post on X describing this level as a supply/demand balance area.
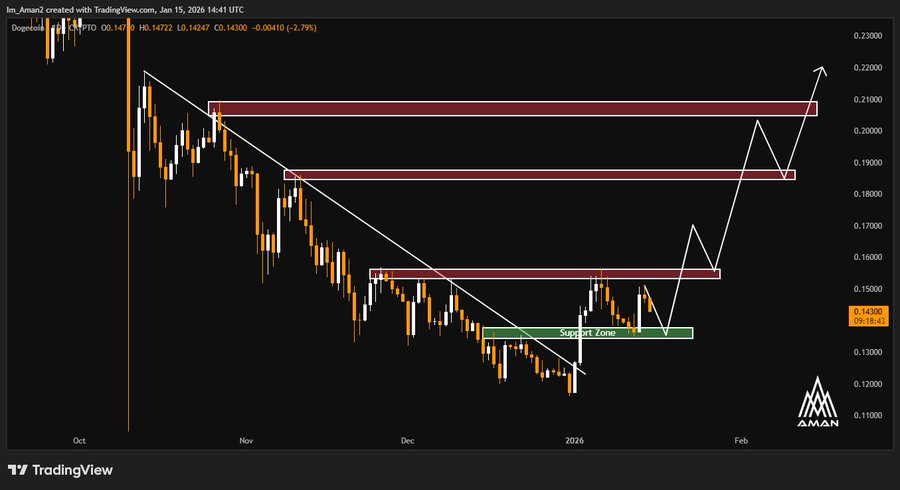
The chart analysed covers a time frame from October 2025 to the middle of January 2026.
After reaching an October peak of just under 0.21, the price action has descended through a series of lower highs, although the last few candles appear to have reduced selling pressure around an area’s long-established demand level.
The demand support area of $0.135 to $0.140 is providing continued support for repeat sell attempts with a continued bullish price reaction to this level.
The length of the lower wick on these is evidence of continued buyer interest and support for all buyers to remain consistent below this level at $0.135 before entering the market.
 Source: X
Trendline Interaction and Resistance Structure
The number of DOGE’s recent price analyses has also focused on identifying a descending trend line from the point of the highest price recorded in October.
This line has served to prevent any attempts at increasing prices over the past couple of months.
The price tested this line and was briefly above the line, but it still does not provide any clear confirmation for establishing new support or resistance levels.
Resistances are most apparent between $0.150 and $0.155, with this being a prior consolidated area of prices.
This area is likely to be the first barrier for any potential recovery. Historically, sellers have defended the prices in this area on prior relief rallies.
Next, higher resistance levels can be seen between $0.180 and $0.190, which is an indication that this was the area of breakdown for earlier price action.
Above $0.190 and moving towards $0.205 to $0.215, we are still within the October distribution range. Based on the structure of prices currently, we have not yet seen prices retest these major levels.
Short-Term DOGE Price Analysis on the Four-Hour Chart
A DOGE Price Analysis on the 4Hr shows a controlled pullback on the heels of a strong recent upside wave that took DOGE from near $0.136 to almost $0.150 within January 13-14.
After a strong upside surge, a slight pause in price action was seen, although momentum was starting to fizzle from the bullish upside, but not appearing to reverse down.
At the time of this post, DOGE was trading near $0.140 and maintains support in the $0.138-$0.140 area.
As evidenced by many candle closes being found in this zone, there is some degree of buyer activity available below this price level, indicating buyer accumulation.
The 9-period EMA is currently in the $0.1417 area and is now offering some short-term resistance.
The MACD readings indicate that momentum is fading, but without any strong signs of downside pressure.
The histogram is slightly negative, and the MACD line is currently near the signal line. As such, these MACD Behaviors indicate potential price consolidations rather than outright failure of an upward price trend.
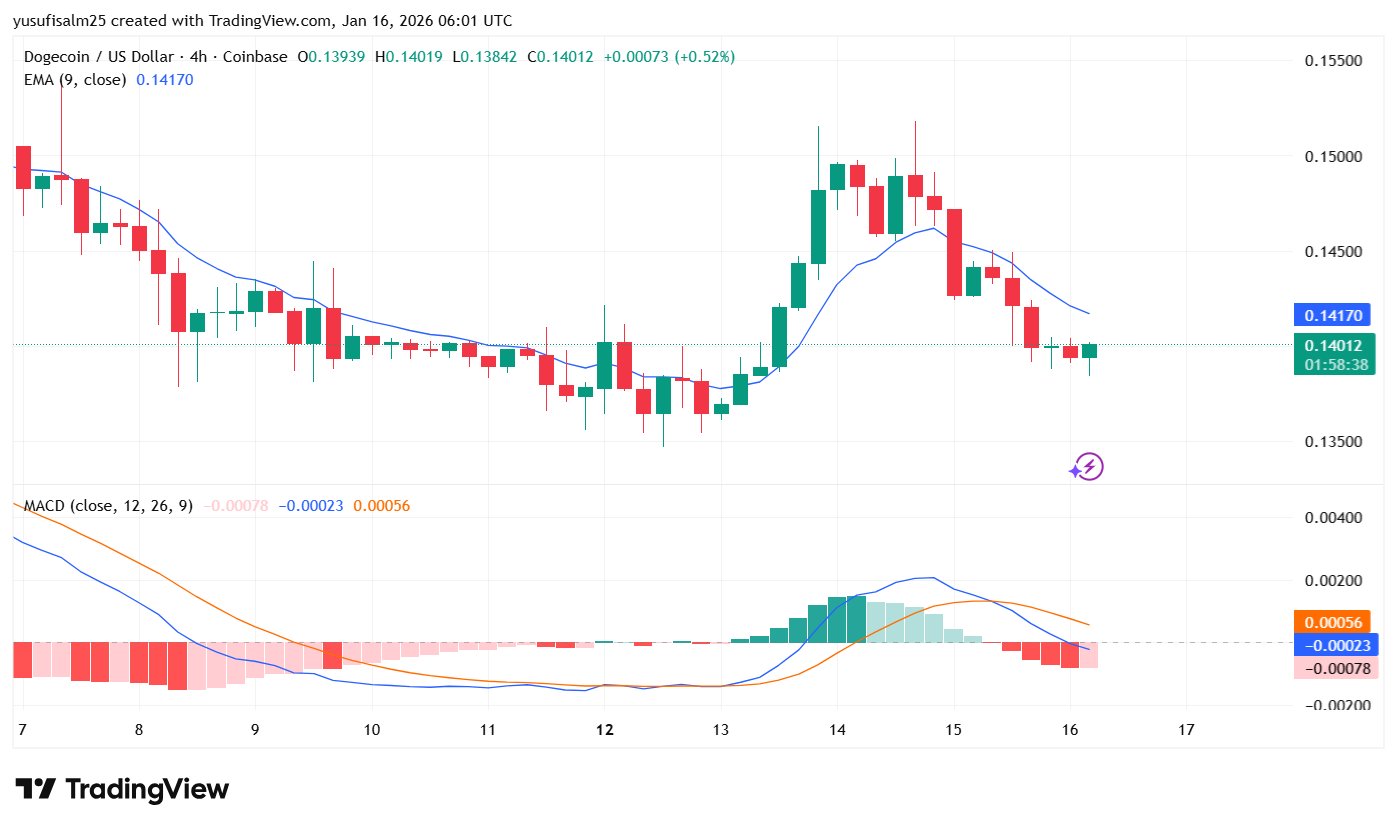
DOGE pulls back from $0.150 resistance, consolidating near $0.140 support as momentum cools on the 4-hour chart. (TradingView)
Open Interest Trends Within DOGE Price Analysis
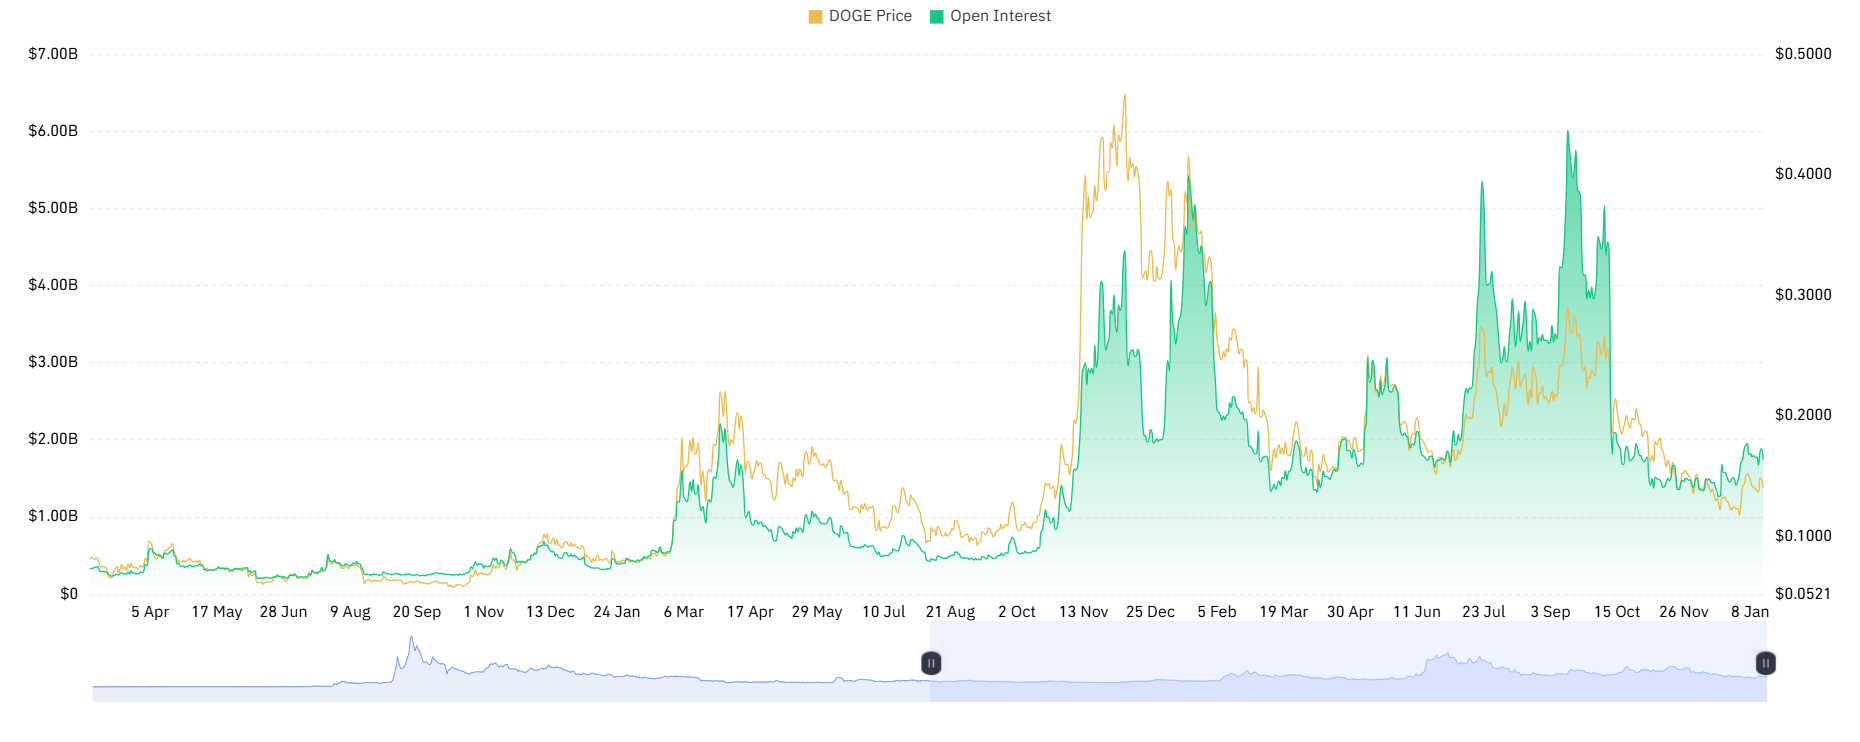
A longer-term DOGE price analysis comparing the price with open interest adds broader context. Earlier market cycles showed sharp price advances accompanied by aggressive leverage expansion. Those periods often ended with rapid price drops and forced deleveraging.
Current open interest levels remain well below historical peaks. This suggests reduced leverage exposure and lower liquidation risk. Price behavior appears driven more by spot activity than speculative positioning.
Historical patterns show that steady price gains with controlled open interest often support more durable moves. Sudden leverage spikes without price follow-through previously preceded volatility. Present conditions reflect stabilization after an earlier excess.
 Source: Coinglass
What Comes Next for DOGE
Price action near $0.135 to $0.150 will help determine the next Dogecoin price trend.
As long as Dogecoin is trading above an established support level, this maintains its current structure and creates an opportunity for a re-test of short-term resistance.
However, if it trades above a downward-sloping trendline, it increases the likelihood of revisiting a higher price level, which would trigger an interest in $0.155.
If Dogecoin does not hold support near $0.135, it may re-test lower price levels down to $0.120.
Based on the recent volume and open interest trends, the overall number of traders entering and exiting Dogecoin is low, limiting the potential for large price movements.
Therefore, traders should monitor volume and follow-through action to discern the direction of future price activity.
Final Thoughts
According to Dogecoin (DOGE) price analysis, it has consolidated technically after recent volatility around these levels. Technical support at approximately $0.135 has been a vital area of price stability, while at approximately $0.150 serves to hold back any immediate gains. The market structure indicates the need for patience, and confirmation will indicate the coming market direction.


