Key Insights
- ICP is trading around its long-term support levels in the form of a falling wedge pattern on the multi-year time scale.
- The daily indicators indicate a stable momentum, with the RSI above 50 and a positive MACD.
- Trends in open interest reflect decreasing leverage and repositioning after a period of market consolidation.
ICP Price Analysis Shows Compression Ahead of Key Breakout
Market participants are closely watching the ICP price analysis as recent charts show a tightening price structure. Shared technical views point to compression near long-term support, with traders assessing whether momentum recovery and positioning data could support a decisive move in the coming weeks.
Multi-Year Weekly Structure Near Decision Zone
According to the post made by Bitcoinsensus, a weekly chart shows an ongoing large falling wedge pattern on the ICP/USDT. This wedge has formed over many years, and the price action continues to tighten up between the two descending trend lines, which indicates less selling pressure.
Support has been tested multiple times between $2.80-$3.40 and has consistently been met with an increase in demand through the creation of long, lower wicks as the price reaches down to touch this area.
The price currently trades at $3.20-$3.30, which is around the wedge support as the wedge is now reaching its apex.
The upper boundary of this wedge was at the $18-$19 range early in 2024 and has steadily been moving lower to the $8-$8.50 area for the last few months.
Based on this structure, if there is a close above the upper trend line, there is a strong possibility that the price will break out.
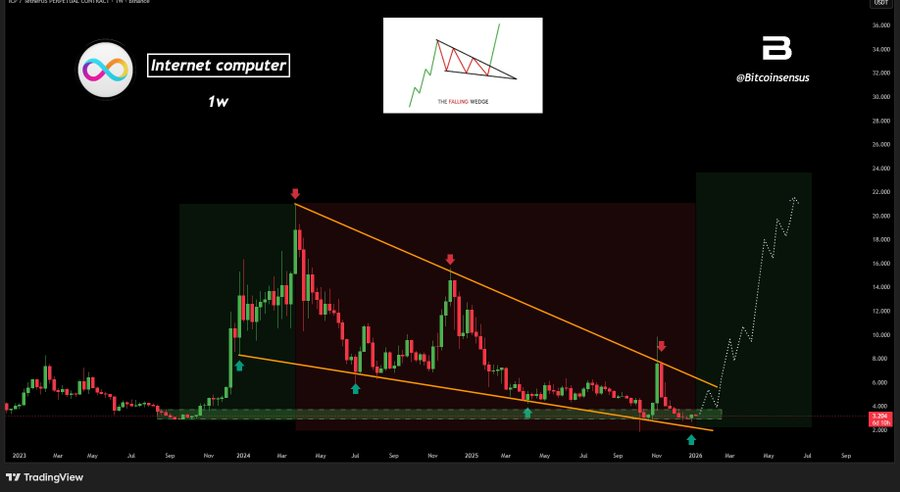 ICP consolidates in a long-term falling wedge, signalling potential bullish reversal after prolonged seller exhaustion. (source: X)
Breakout Levels and Measured Targets
The weekly formation closing above the $4.20-$4.50 zone reflects a shift in technical analysis. This level aligns with both resistance levels of the wedge and a previous peak, and this break is often viewed as an opportunity by traders to join an ongoing trend.
Projected targets from the charts are $8.00-$9.00 for the first load zone, further resistance levels close to the $12.00-$14.00 zone, and a larger price projection between $18.00-$22.00 based on historical price reactivity and the wedge’s range.
The failure to maintain support at the $2.80 level would remove the bullish structure, at which point the price will continue to consolidate until such time that the price can re-establish itself as outlined in this ICP price analysis.
Daily Chart Signals: Momentum Stabilization
As of this writing, on the daily chart, ICP has recently settled down near $3.39-$3.40 after a long decline from November’s highs. Prices have now developed within a narrow price range that has been bouncing back from the $3.10 support level and retesting resistance levels in the $3.80-$4.00 area.
Momentum indicators are showing signs of early stabilization. The RSI has regained the 50 level and continues to move upward with respect to its moving average; the MACD has produced a bullish crossover along with a positive histogram, which indicates these levels may serve as support during trend recovery.
If prices close above $4.00 daily, they will create an opportunity to move toward the $4.80-$5.20 area. These price levels were previously considered breakdown areas.
If there are any further daily closes that remain below the support level of $3.10, this would be considered a negative development and would increase downside risks.
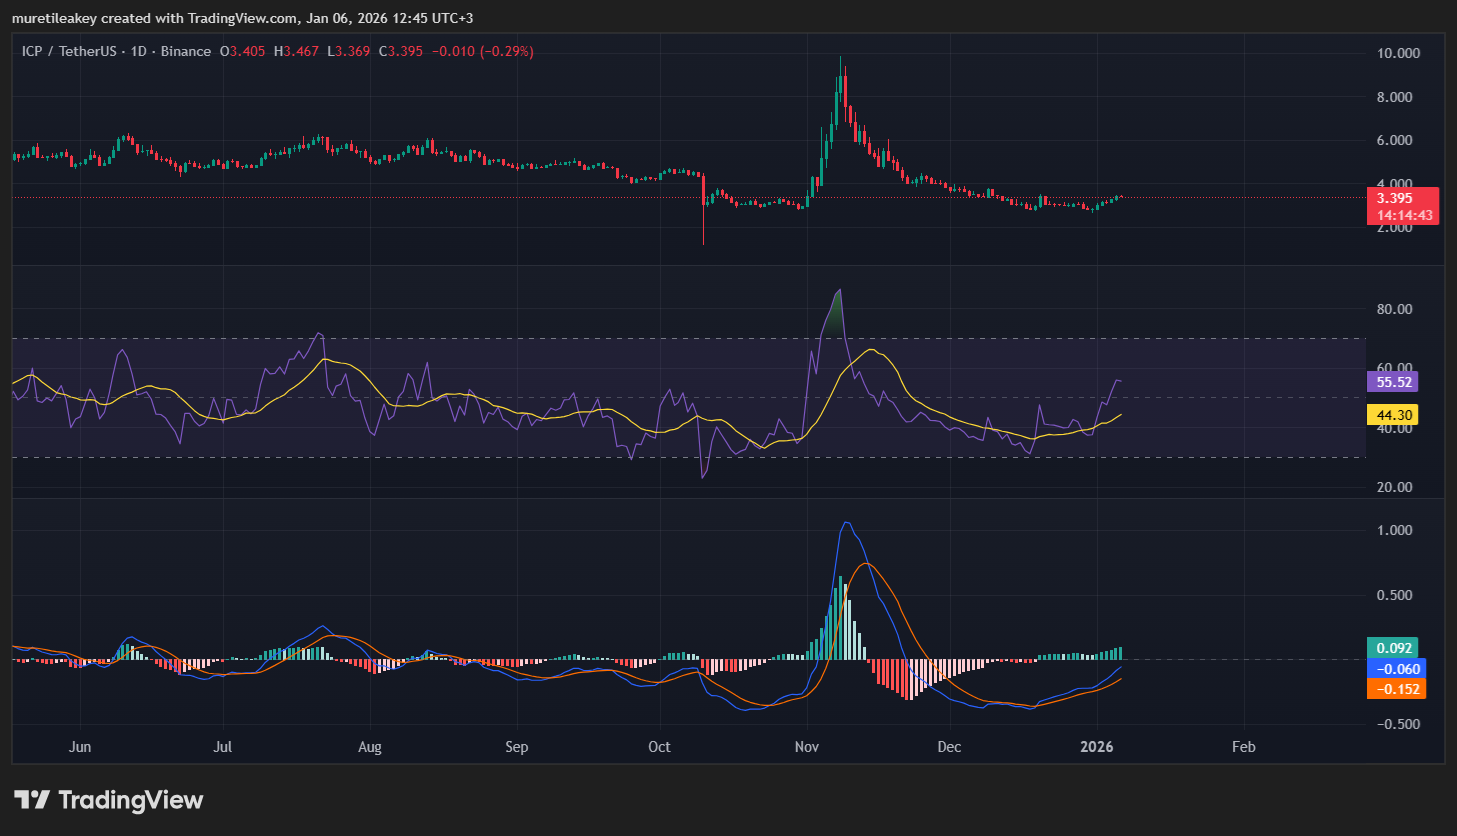 ICP consolidates above the key support as RSI and MACD turn bullish, signalling potential upside breakout momentum. TradingView
Open Interest Trends Add Context
Another mutual chart plotted the ICP price and open interest over market cycles. Early phases involving accumulation saw low prices and leverage. The correlation between increasing prices and increasing open interest levels became evident in the rallies.
Following the major peaks, open interest dropped considerably with the fall in price, indicative of a strong deleverage. Currently, observations indicate that open interest is flattening out as the price is consolidating around historical lows.
There was a sharp jump in open interest, which did not translate into a hold in the price, causing an immediate rejection. There has been obvious over positioning. For a healthy move, it will be necessary to have a controlled increase in leverage with price appreciation, which has been suggested in the price analysis of the ICP.
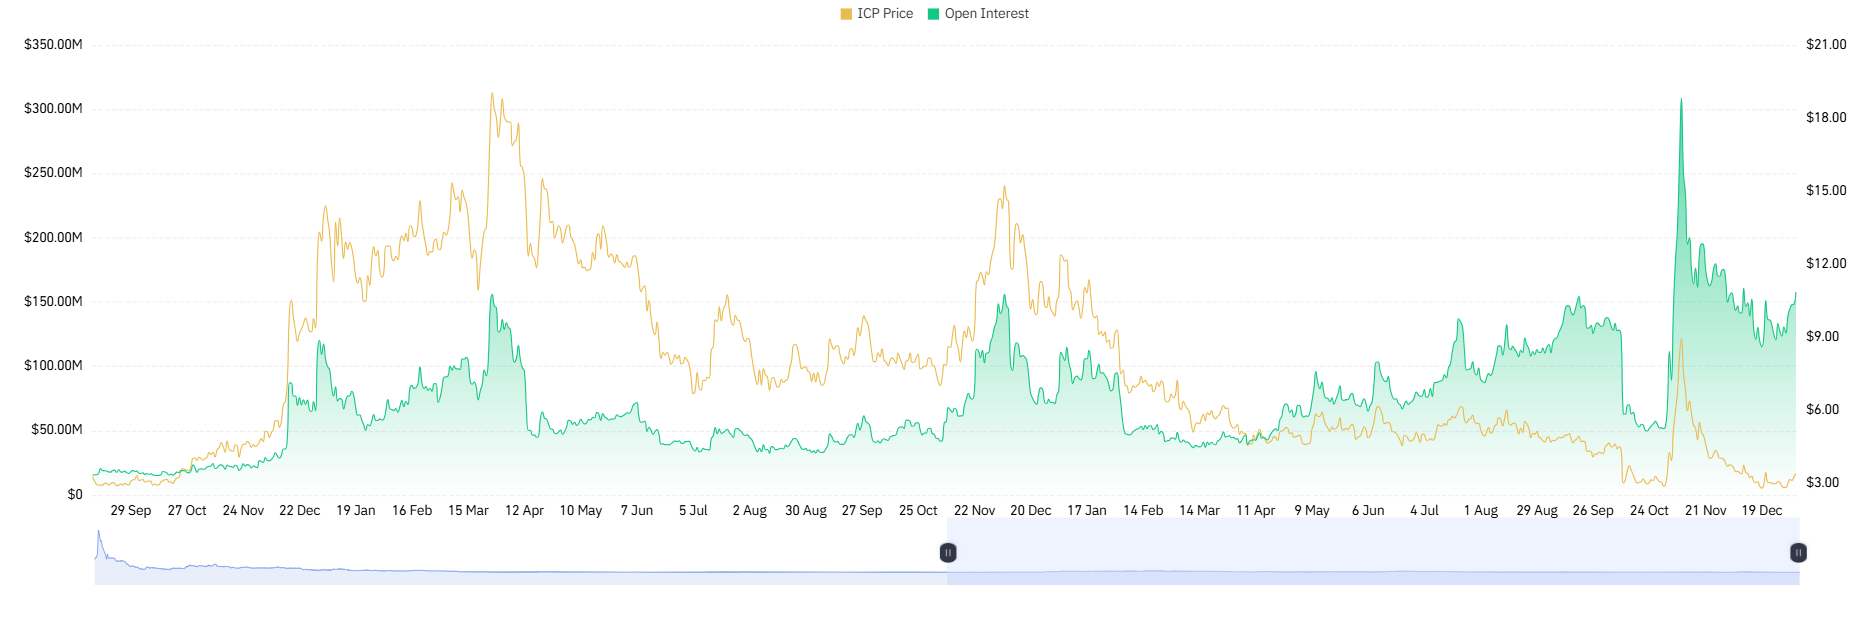 “ICP price cycles reveal leverage-driven rallies, deleveraging phases, and rising open interest signalling future volatility risk.”(CoinGlass)
Final Verdict
The price analysis for ICP indicates that the market is about to resolve. With Compression Week and the recovery of Daily Momentum, along with lower leveraged positions, the market has turned our focus onto key breakouts.
The focus of traders is whether price action strength can align with positions that are well-structured. Until there is a definitive move, traders continue to use support and resistance Zones as a means of determining short- and medium-term expectations based on a well-defined range.