Key Insights
- Governance approval of 70 million ADA boosts confidence in the infrastructure and continuous operations of Cardano.
- The ADA continues to trend upwards from key support zones, with strong momentum indicators being seen.
- Key upside targets (resistance) remains; $0.418 and $0.442 due to retaining the bullish structure.
ADA Price Prediction Improves as Cardano Approves 70M ADA Funding
Cardano has once again received significant interest from the market following its governance body’s approval for the allocation of 70 million ADA towards improving infrastructure. In addition to this, technical analysis on a four-hour timeframe shows a trend of increasing momentum for Cardano, which has contributed to the current ADA price predictions.
Cardano Governance Approves 70M ADA Allocation
According to a statement shared by MinswapIntern on X, participants in the Cardano governance process voted to approve a 70 million ADA withdrawal to aid in developing critical infrastructure.
The funding that has been approved is intended to be used to help provide support for tools being developed for Cardano, maintain network reliability, and establish long term sustainability of the Cardano ecosystem.
These types of governance actions are tracked closely by market participants and have an impact on their confidence regarding the continued development and stability of protocols.
ADA Technical Structure Shows Trend Recovery
The market data provided by DYOR.net indicates that ADA is trading above the important exponential moving averages and close to $0.3874, with the four-hour chart showing that ADA has been above the $0.364 area, which is a significant short-term structure for traders.
The technical indicators are positioned positively on the ADA short-term price prediction narrative that many traders use to make their trading decisions, with the ADX (average directional movement index) indicating that the market sentiment is bullish, and the Super Trend also indicates a buy signal.
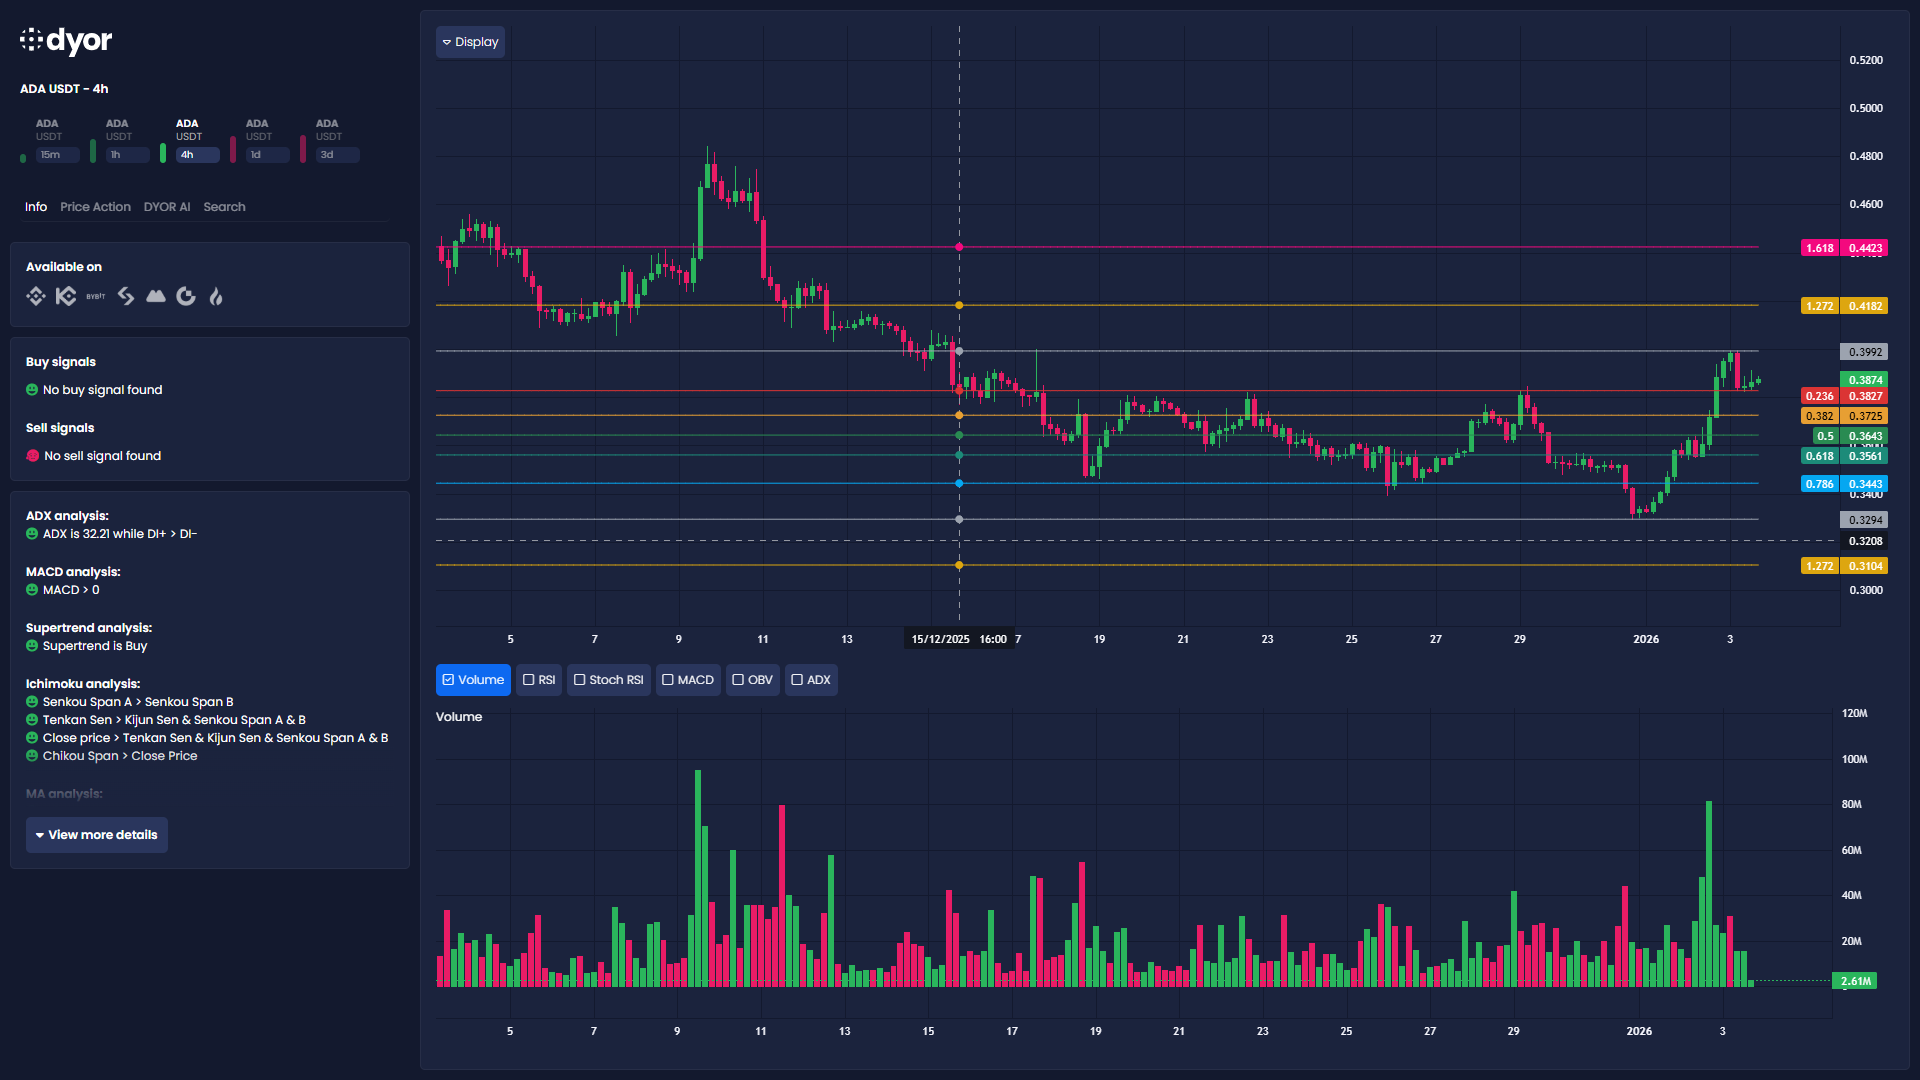 ADA/USDT shows bullish breakout with strong momentum; key resistance at $0.3992, potential
target $0.442.(Source:X)
Momentum Indicators Support Upside Continuation
More improvements can be seen in these indicators, supporting the improving momentum. The MACD is presently above zero, indicating strong bullish momentum; The Ichimoku indicator shows that the price is currently above the cloud resistance and also aligned to the support lines.
The recent price increases show a significant increase in Volume followed by a decrease in Volume during consolidation. This is often viewed as a sign of continued momentum and is likely to provide reasonable cause for a level of cautious optimism regarding ADA’s short-term Price Prediction outlook.
 ADA breaks above mid-Bollinger Band, RSI nears overbought, signaling strong momentum
but short-term resistance ahead. (TradingView)
Key Levels Guide Near-Term Market Focus
As per the shared chart analysis, the short-term resistance is just under $0.3992. It would take a sustained breakout above this key level before looking to the next upside potential zone at $0.418 and/or $0.442, based on Fibonacci Extensions.
The support area remains fixed between $0.364 and $0.382, where the buyers have previously stepped in to defend the market. As long as the ADA price remains above this region, future price predictions for ADA will remain in line with continuation scenarios rather than reversal scenarios.
Market Context and Final Thoughts
Current price predictions for Ada continue to evolve as a result of the combination of Governance-Based Capital funding and a stronger technical structure.
In addition to Price’s movement around Resistance, traders are also looking at Volume and Momentum indicators to make their trading decisions.
With the clear governance component now defined, traders will watch to see how well Ada can continue the Up trend structure over the next several sessions.