Key Insights
- NEAR’s price surged past the descending channel, indicating increased bullish momentum and the formation of higher lows on the 4-hour chart.
- RSI and MACD show a high level of buying interest, indicating a potential pathway toward the resistance areas at $1.75 – $2.10.
- Open interest indicates that there are still many leveraged positions benefiting from increasing NEAR values, giving NEAR room for further upside potential.
NEAR Price Shows Early Signs of Bullish Breakout
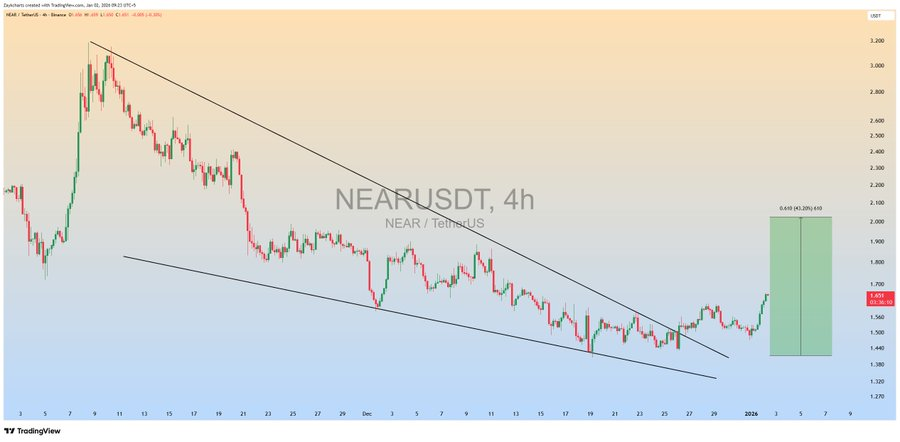
NEAR price analysis indicates near term bullish movement. ZAYK Charts indicate a recent breakout, resulting in +12% gains, as buyers enter the market. Charts indicate the price has moved above $1.50 on the 4-hour timeframe, thus paving the way for an increase towards $2.10 in the near future.
Trend Structure and Price Action
Near price analysis. According to the ZAYK Charts, the NEAR/USDT trading pair was indeed trending lower over the past few weeks, establishing a lower-high-lower-low price action pattern.
The prices of the token have moved in the range of $1.35-$1.45 to the downside and from approximately $2.90-$3.00 to the upside.
However, after the candle breaks above the lower boundary of the trendline, it is an indication that bearishness may no longer persist, thus indicating a possibility of a trend reversal and an upward movement in price.
Since breaking through that boundary, NEAR has begun creating higher lows while building bullish momentum through positive price action with potential upward directionality of NEAR’s near-term trend.
The immediate resistance level is currently between $1.66-$1.68, with the next big target being in the range of $1.90-$2.10. Significant levels of support are found in the $1.55-$1.50 area, which is considered a key “buy the dip” area.
Additionally, the Fibonacci 0.618 retracement level originally looked to be set to hit the $2.05-$2.10 level as a target, which also reinforces this target area.
 Source: X
Momentum Indicators and Technical Signals
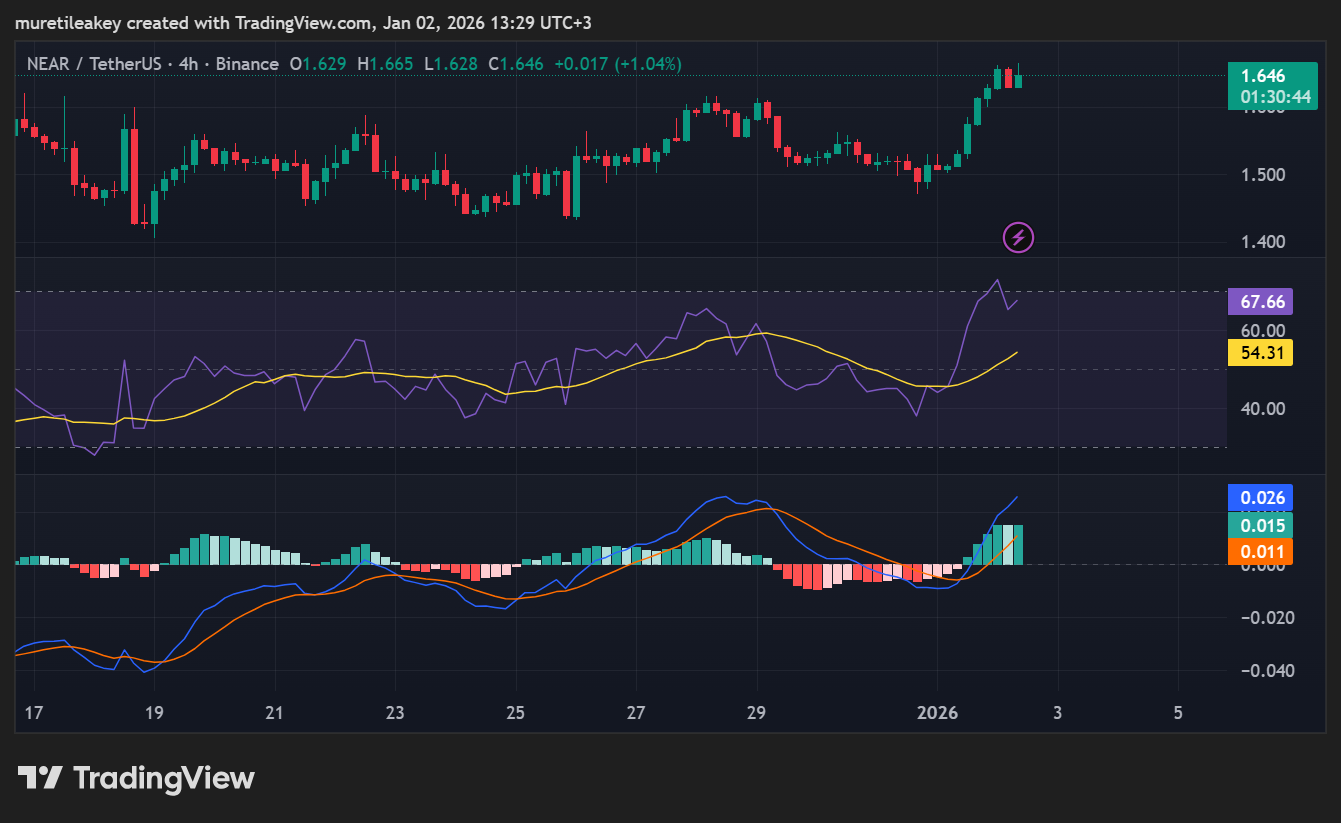
Positive momentum of NEAR price analysis supports this bullish shift. Currently, the RSI is at 67.66, moving above the average of 54.31, indicating strong momentum without showing any overbought conditions.
Additionally, the MACD line has crossed above the signal line, with expanding histogram bars and confirming accelerating upward movement.
Together, the RSI and MACD indicate buyers are still in charge and that some form of short-term consolidation may take place before the next upward leg.
Areas of potential pullbacks to $1.58-$1.55 could be areas where demand will absorb sell pressure, allowing price movement to continue to $1.75, and higher.
 Source: TradingView
Price vs Open Interest Analysis
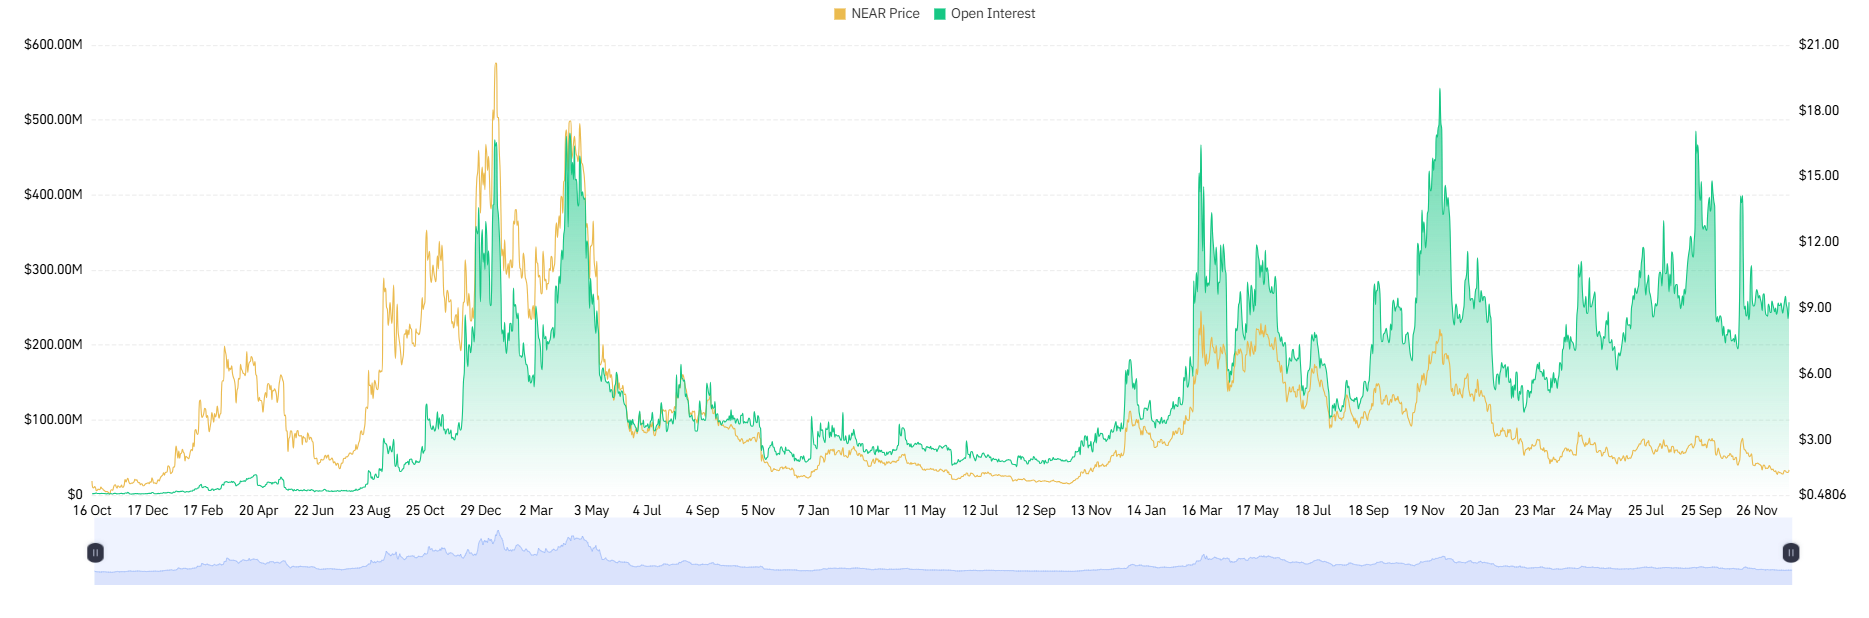
Overlying NEAR price analysis with information on open interest highlights the leverage present on the market. Open interest levels peak well above 135 million contracts while price levels stay below peak levels on past cycles.
This implies that rallies in recent days are partly a result of leveraged holdings rather than spot demand.
Traditionally, large open interest and a flat or trending downward market could result in volatile markets. Shocks to a positionally driven market may imply large downside movements.
On the flip side, a smoothly increasing open interest accompanied by an increasing price strikes a positive sentiment for a sustained accumulation, hence promoting an Upside.
 Source: Coinglass
NEAR Price Analysis: Potential Scenarios Ahead
If NEAR stays above $1.58, we can expect a bullish continuation to $1.75-$1.90. Consolidation between the areas of $1.58 and $1.68 gives the time necessary for momentum to reset.
If there is a break below $1.50, however, it may revert to a much broader corrective trend.
Observing open interest alongside price movements allows traders to better assess whether the rally has continued support from true buyers.
A recent tweet from ZAYK Charts confirms the breakout so far and validates the positive momentum targeting $2.10 in the medium term.
When establishing positions, all participants should take into consideration both trend and leverage factors.