Key Insights
- Chainlink LINK price confirmed a higher-timeframe breakout after weeks of compression near the $12.80 support zone.
- Short-term charts show rising momentum as volatility expands and buyers maintain control above key moving averages.
- Institutional adoption and reserve accumulation continue to support Chainlink’s growing role in on-chain finance infrastructure.
LINK Price Breaks Trendline as Market Structure Improves
The Chainlink LINK price is indicating an increase in strength after the price broke a historical descending trend line on multiple time frames. There are also improvements based on technical indicators that demonstrate LINK price is being maintained above its most critical supports, and additional interest in the market by institutions, and an increase in on-chain activity.
Chainlink LINK Price Breaks Multi-Month Technical Resistance
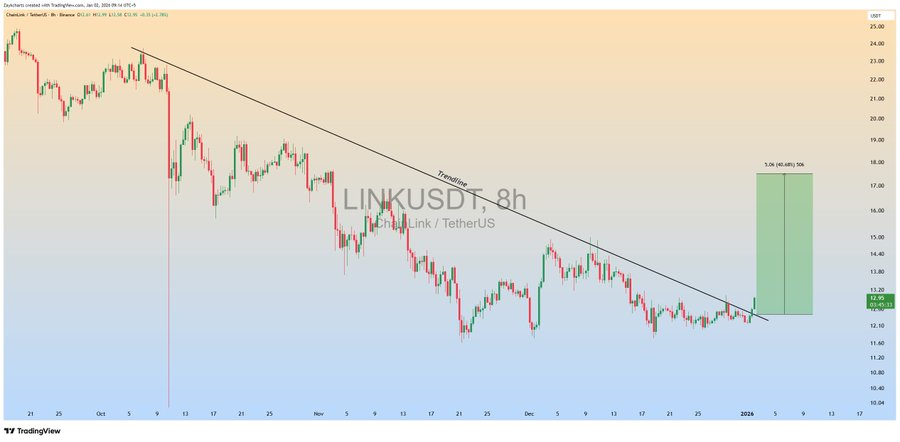
According to ZAYK Charts, Chainlink LINK has recently broken through a descending trendline. That had been in place for months since October and had previously been a barrier to upward movement. During several unsuccessful recoveries over that same period.
The October sell-off that created this price compression was followed by a period of relatively stable price behaviour, where LINK traded within a very tight range between support and resistance levels.
As LINK sold off and as selling pressure declined, it allowed for reduced volatility and paved the way for the next directional move due to increased bullish momentum. The breakout of this downward trendline was confirmed by the breakout candle created by LINK closing above the downward trendline on the weekly chart.
Additionally, LINK was able to sustain its price above the previous downward-trend resistance zone of around $12.80. This breakout from $12.80 was not just random spikes in prices, but the result of an underlying structural bullish trend that was forming.
 Source: X
Short-Term Charts Show Improving Market Structure
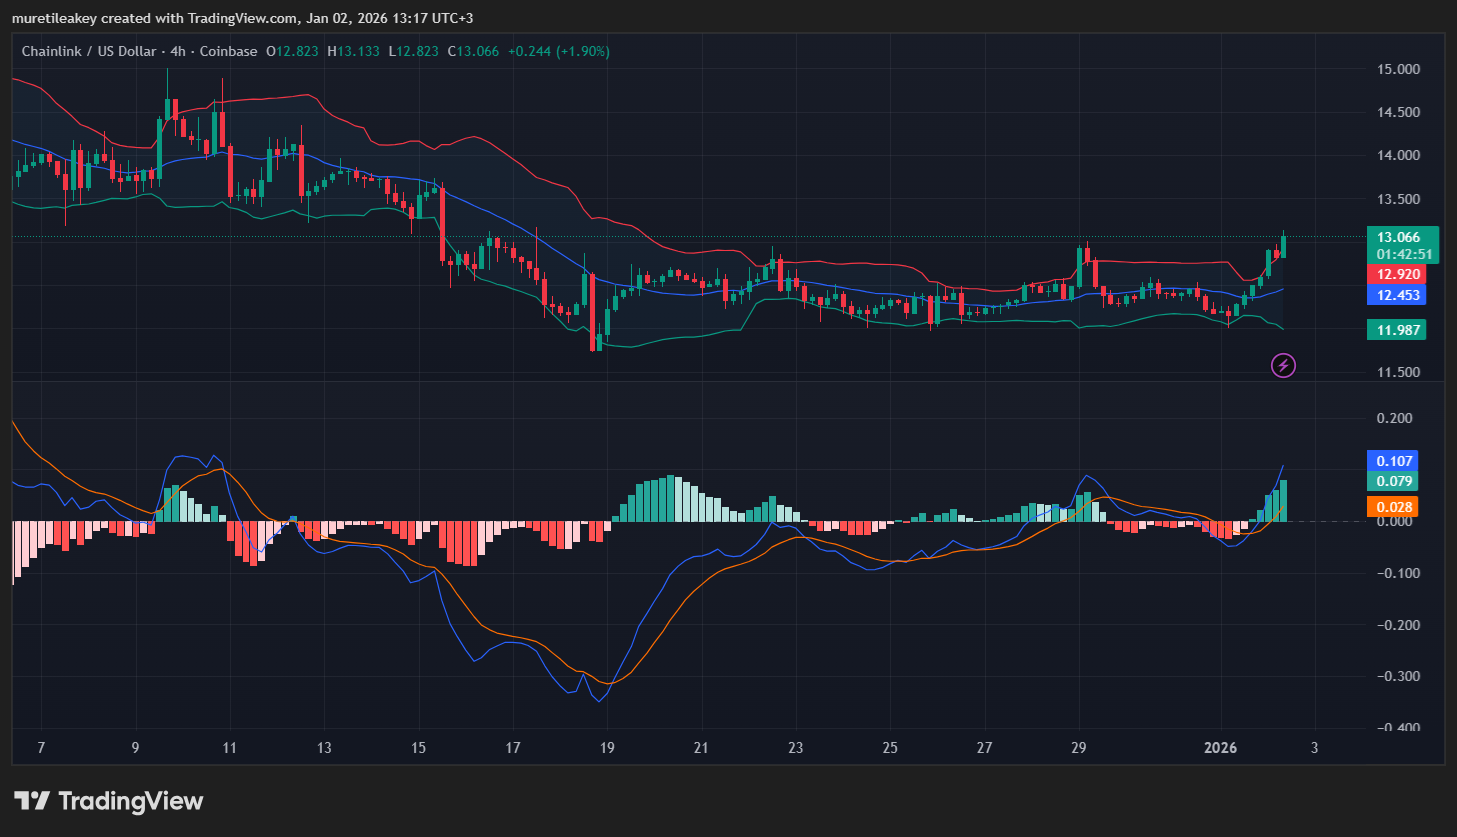
Chainlink LINK price continues to make steady advances on the shorter-term charts. The 4-hour chart shows higher lows being created above $12.40 now acting as support in a dynamic fashion for the Chainlink LINK price and charts.
The increasing level of volatility supports the upward movement of Chainlink LINK’s price. The widening Bollinger Bands indicate that Chainlink LINK is trading above the mid-band of the Bollinger Band indicator.
LINK is experiencing expansion – an increase in volatility rather than stability or consolidation. The flattening and upward trending of the moving average further supports this volatility expansion.
In addition, momentum indicators also confirm the bullish shift in Chainlink LINK’s price. The Moving Average Convergence Divergence (MACD) has crossed the 0.0 threshold into bullish territory for the first time.
This shows more histogram bars expanding in bullish territory. As long as Chainlink LINK holds above near-term support, the bullish structure should remain valid and intact.
 Source: TradingView
Institutional Adoption Shapes the Broader Narrative
CryptosRus provides an overview of the Forbes article discussing structural trends affecting blockchain markets. Institutions have shifted their focus from short-term trading to longer-term capital deployments, and interest in developing a regulated blockchain presence through custody services and tokenization platforms.
Ultimately, it appears that investors will place more value on networks with proven reliability and verifiability of network data services than on volatile price movements associated with rapidly changing speculation.
Chainlink fits into this trend by delivering data streams and interoperability solutions that institutions and governments use to access the benefits of blockchain’s value proposition. In this context, Chainlink provides consistent accumulation, as opposed to speculative, rapid price valuations.
On-Chain Activity Reinforces Network Confidence
As Chainlink enhanced its role in on-chain finance in 2025, Coin Bureau noted that both government entities and organizations began using Chainlink’s technology to publish verified economic information onto the blockchain.
Coin Bureau cited an example where the United States Department of Commerce published macroeconomic statistics through Chainlink oracles’ feeds. The fact that Chainlink’s technology is currently in operational use highlights its adoption, not solely for experimental testing purposes.
Cointelegraph provided information that in recent months, over 94,000 LINK tokens have been added to the Chainlink Reserve. That brings total holdings of LINK tokens to over 1.4 million LINK tokens, thereby strengthening the level of trust during times of market consolidation.