Key Insights:
- The Solana network is growing in usage, but prices are flat, therefore indicating an ongoing demand signal below market value.
- Open interest is increasing, so prices are stable, indicating structure as opposed to speculative trading levels
- The price compression based on tight trading bands indicates that generally this will precede volatility expansion in established consolidation patterns.
Solana Price Prediction as On-Chain Activity Outpaces Price
As Solana continues to be in a range-bound price channel due to increased network usage and derivatives activity, there is an increase in both on-chain activity and open interest and decreasing volatility. This combination of variables will frame the price prediction for Solana based on structural support rather than near-term momentum.
Usage Growth Sets the Foundation for Price Expectations
CryptosRus has recently commented about Solana’s on-chain activity being greater than the on-chain activity found with centralized exchanges (Binance and Coinbase).
They emphasize that despite a static price, the volume of transactions and fees continues to grow. This upward usage trend creates the minimum price prediction baseline for Solana.
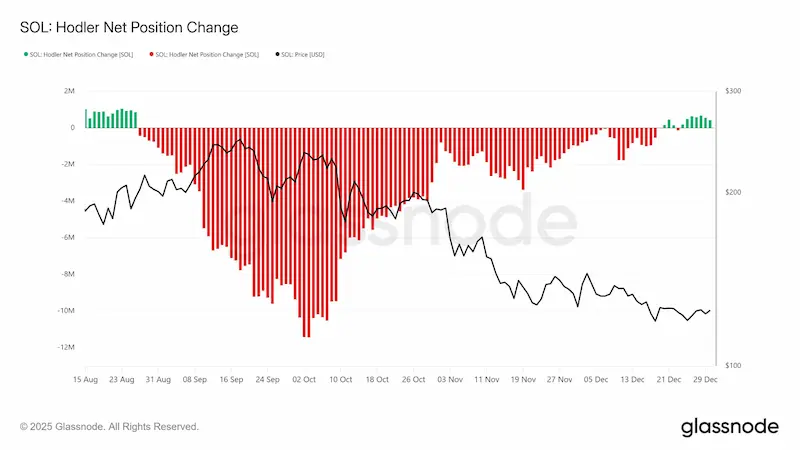
The increased amount of network participation indicates that there’s more genuine demand for Solana than mere speculation. Developers and users alike maintain activity on the network when the price isn’t on the front page.
Historically, until we adjusted the value of Solana based on the rapid increase in usage, increased use typically occurred before any significant adjustments to the valuation.
The flat price along with higher activities indicates that we have reached an equilibrium, not weakness. Participants in the market will see this as supply being absorbed.
Therefore, metrics related to usage will play an increasing role in determining the expected price movement for Solana.
 Source: X
2025 Ecosystem Expansion Adds Context to Valuation Models
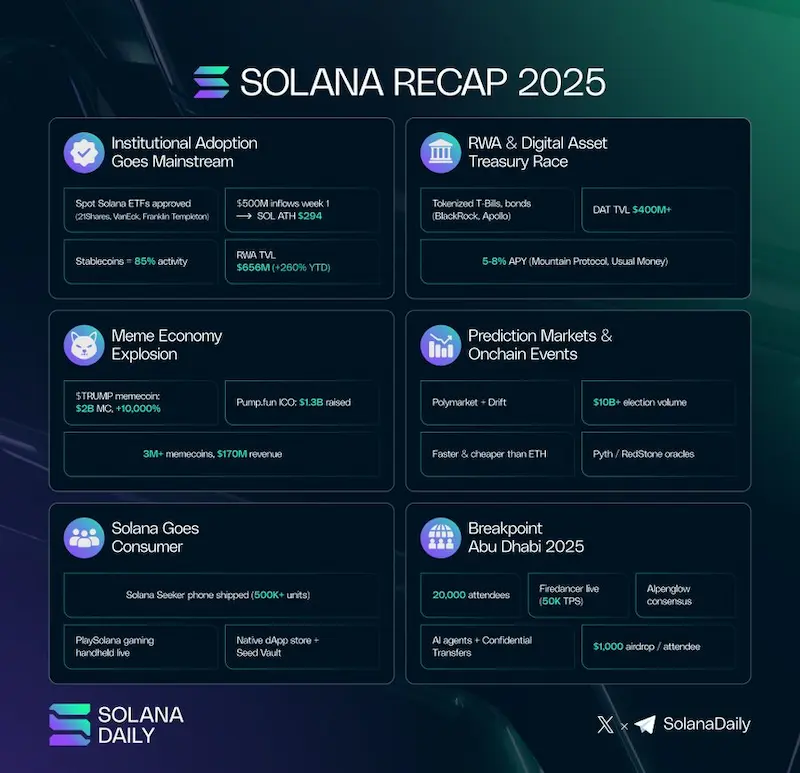
According to Solana Daily, 2025 will be a large breakout year for the Solana network. They noted institutional inflows, real-world assets, and consumer-focused applications. Each of these has broadened the valuation framework behind Solana’s price predictions.
The added value created by meme activity and prediction markets has created consistent engagement within these communities.
Day-to-day transactions generated from this engagement occurred more frequently than typical by means of speculative market activity. This increased frequency of use provides more stable usage during times of corrective or market fluctuations.
Once an ecosystem matures, price behavior tends to become more structured than speculative in nature. Prices will tend to stabilize when considering the amount of liquidity and how widespread the adoption of a platform is.
The investment community has a stronger argument for believing that Solana’s future price potential will be consistent and will not change.
 Source: X
Open Interest Trends Signal Anticipatory Positioning
Long-term charts comparing SOL price with open interest show clear patterns of market cycles over time. The beginning of the accumulation phase saw SOL prices flat with low levels of leverage. At this stage, organic positioning was much more prevalent than active trader speculation.
During the Expansion Phase, the SOL price had begun to rise in conjunction with increased open interest. The reduction phases’ declines in open interest were a reset on leverage levels. As of today, we continue to see increased open interest while the SOL price continues to stay below previous highs.
The divergent relationship between Volt price and open interest demonstrates an interest in established trader positions prior to confirmation of price movements.
These actions typically precede directional movement of Volt Price and not the “topping” or “exhaustion” of a market’s movement. Thus, open interest will continue to drive current analysis of SOL asset price predictions.
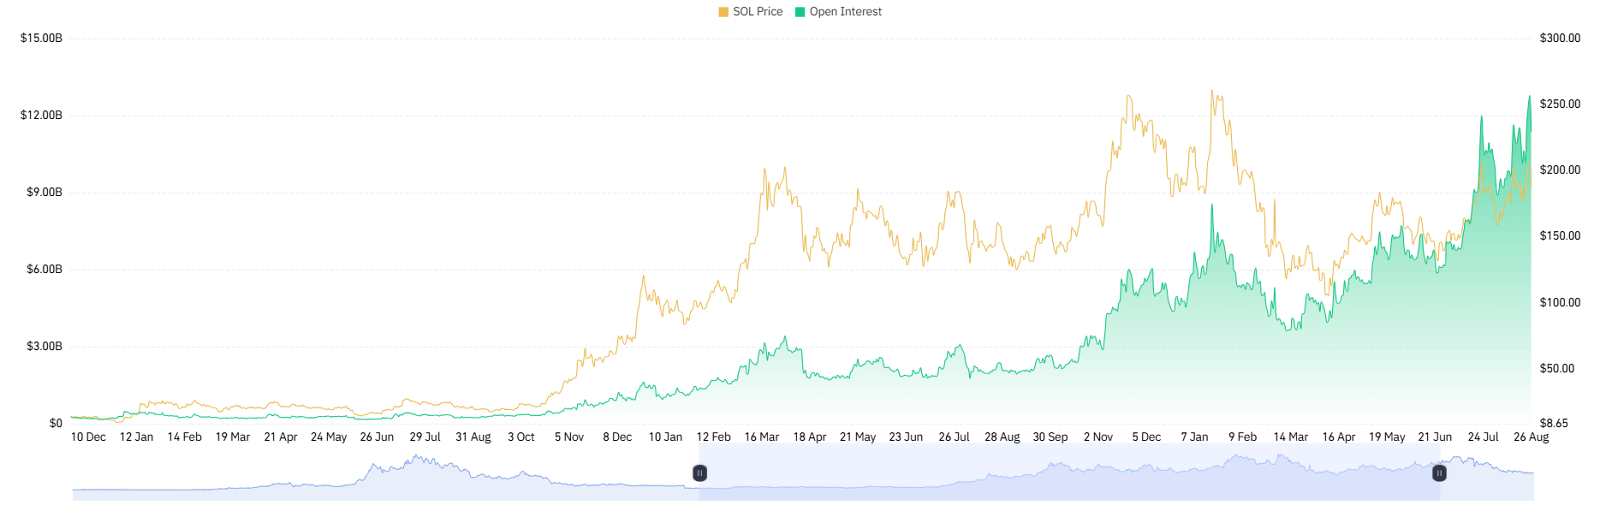 SOL price structure strengthens as rising open interest signals renewed speculative
positioning and potential trend continuation. (Coinglass)
Short-Term Price Structure Defines Near-Term Scenarios
On the four-hour Coinbase chart, SOL trades near the mid-$120 range. Price previously declined from the $140 to $145 area. Recent action shows consolidation between $122 and $128.
The tight Bollinger Bands indicate compressed markets, and the fact that the price is stuck around the middle band signifies equilibrium between the buyers and sellers. Rejections around $127 to $128 continue to suppress price.
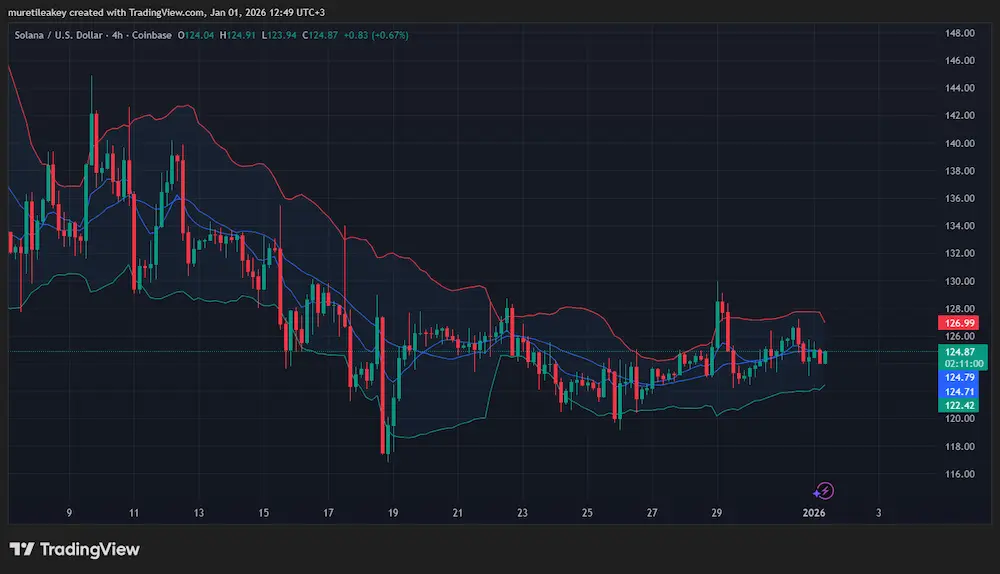 “SOL consolidates near $125 as volatility contracts, signaling a potential breakout between
$122 support and $128 resistance.” (TradingView)
Support remains firm near $122, with deeper support near $118.50. A sustained move above $127 could open room toward $130 to $134. Until then, the Solana price prediction favors range continuation with breakout risk building.