Key Insights
- AVAX is demonstrating month-over-month increases in value, starting at $1.08 in January and ending at $6.62 by June of 2026.
- Technical indicators such as the RSI and MACD are indicating persistent weakness in momentum as the price reaches levels of historical support or resistance.
- The sustained rise in open interest suggests that market participants are slowly but surely reestablishing their positions in AVAX.
Can AVAX Price Prediction 2026 Reverse the Downtrend?
Long-term charts for Avalanche have dipped well below Cycle Lows. Long-term monthly indicators indicate a weak momentum, as shown in the indicators below. Long-term projections for 2026 indicate a slow recovery trend.
With the majority of both the spot and derivatives markets now occupied with a well-founded patient base versus speculative positions, we will continue to monitor how the situation may change over time.
Long-Term Price Structure Remains Compressed
The monthly AVAX chart on Binance captures the full cycle since late 2021. Price peaked near the $145 to $150 region before entering a deep macro decline throughout 2022.
Following capitulation, AVAX spent an extended period consolidating between roughly $10 and $20. This base defined the market structure for much of 2023 and early 2024.
A recovery rally during 2024 lifted prices into the $35 to $45 zone. Momentum faded afterward, producing lower highs and renewed selling pressure.
The most recent monthly candle opened at $13.72 and closed near $12.49. Price reached a high of $15.09 and a low of around $11.26.
This decline of about 8.9 percent kept AVAX pinned near key demand. Traders continue watching the $11.20 to $12.00 zone closely.
A monthly close below that area could expose the $9 to $10 region. Resistance remains layered near $15 to $16, then $20 to $22.
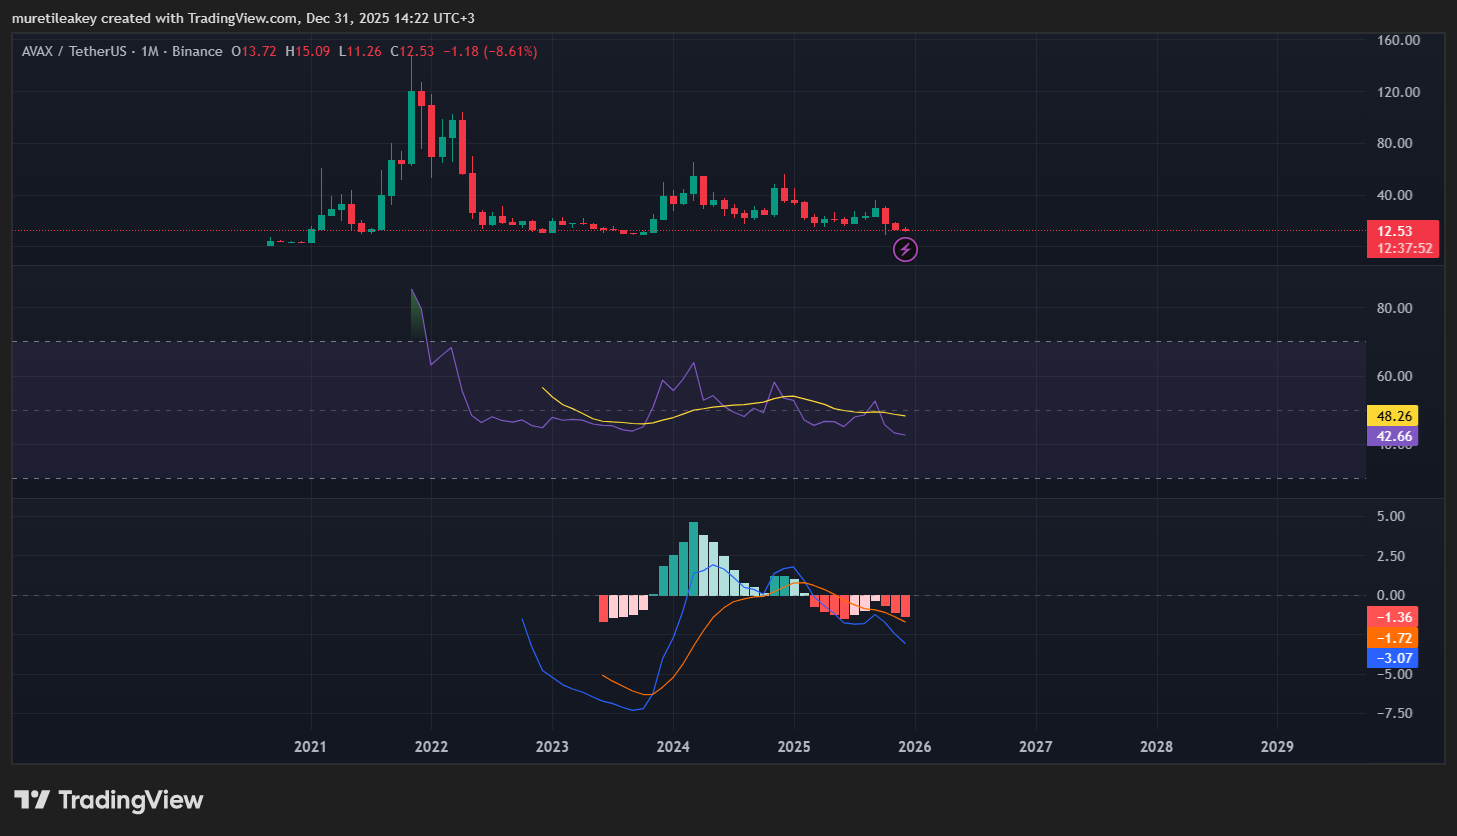 AVAX remains in a monthly downtrend, testing critical $11–$12 support as bearish momentum persists across indicators. ( TradingView)
Momentum Indicators Reflect Ongoing Caution
Monthly RSI remains below neutral territory, sitting near 42.64. The RSI moving average near 48.26 has not been reclaimed.
This positioning shows sellers still control the broader trend. Momentum has weakened, though conditions are not deeply oversold.
MACD readings reinforce this tone. The MACD line sits near minus 3.08, while the signal line holds near minus 1.72.
The histogram around minus 1.36 continues expanding on the downside. This structure points to renewed bearish pressure rather than trend recovery.
Without a sustained move above $20, rallies continue appearing corrective. Several analysts echoed this view on social media, noting repeated failures near range highs.
Such commentary reflects broader caution across altcoin markets. Avalanche remains aligned with this wider risk-off behavior.
AVAX Price Prediction 2026 Shows Gradual Climb
The AVAX price prediction 2026 table shared by Changelly outlines a steady month-by-month increase. Each projection lists minimum, average, and maximum price estimates.
January 2026 starts near $1.08 to $1.10, with deeply negative ROI readings. By June, projections rise toward the $6.50 to $6.62 range.
Despite negative ROI persisting, prices increase by roughly one dollar monthly. The model reflects structured rebuilding rather than rapid appreciation.
Ranges between minimum and maximum prices remain tight. This suggests low projected volatility across the forecast period.
The AVAX price prediction 2026 emphasizes accumulation conditions instead of speculative runs. The table maintains consistent buy signals throughout the first half of the year.
If the trajectory extends, double-digit prices could emerge later. However, the pace remains measured, tied to stabilization rather than hype.
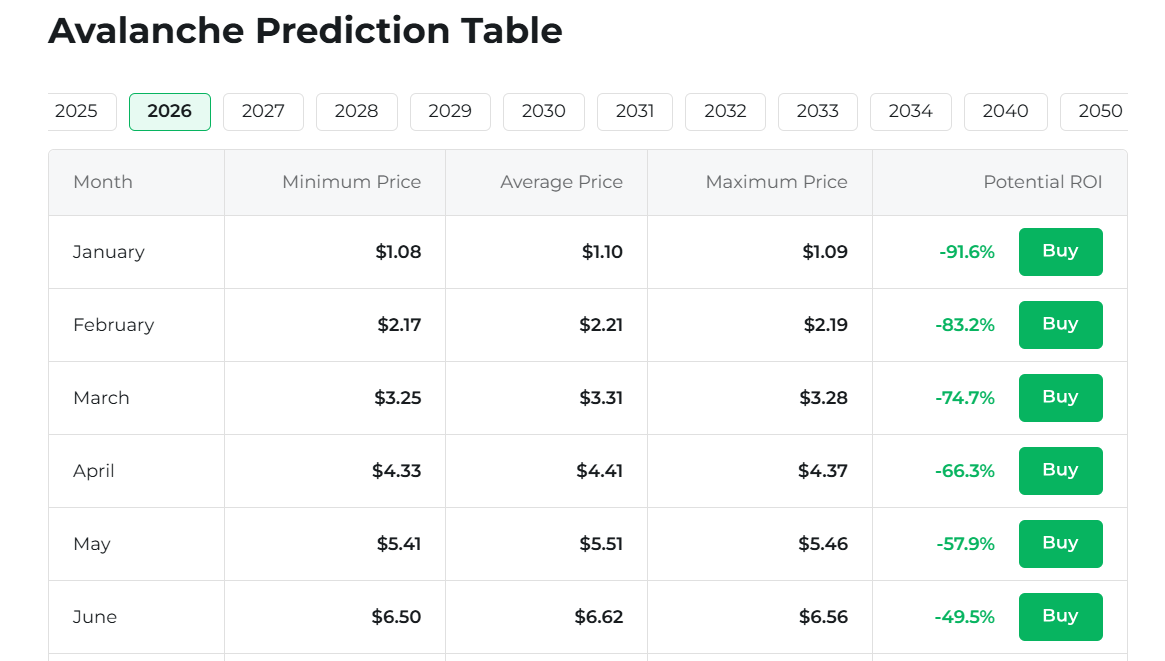
Avalanche’s 2026 outlook shows steady monthly price growth, improving ROI, and gradual recovery from deep bearish valuations. (Changeally)
Derivatives Data Points to Resetting Leverage
The second chart overlays the AVAX price against open interest and the metric of how many positions are currently open. Initially, prices remained stable, and leverage was minimal.
A strong move upward was then made, accompanied by a rise in open interest. After that, there was a top and a controlled pullback.
The following rallies couldn’t continue upward, creating lower highs and confirming that the trend was over. Subsequently, open interest continued to rise with no continuation in price.
The absence of a price move up while at the same time having a large increase in the open interest is often an indicator of crowded leverage and high liquidation risk. This was followed by a sharp drop in value that matched the weakness in the price.
However, in the bottom section of the chart, you can see that the amount of participation has continued to remain structurally higher than in previous cycles.
The recent flattening gives an indication of cooling off rather than fresh risk appetite. Therefore, with the AVAX price prediction for 2026 to support the gradual creation of value rather than an explosive growth.
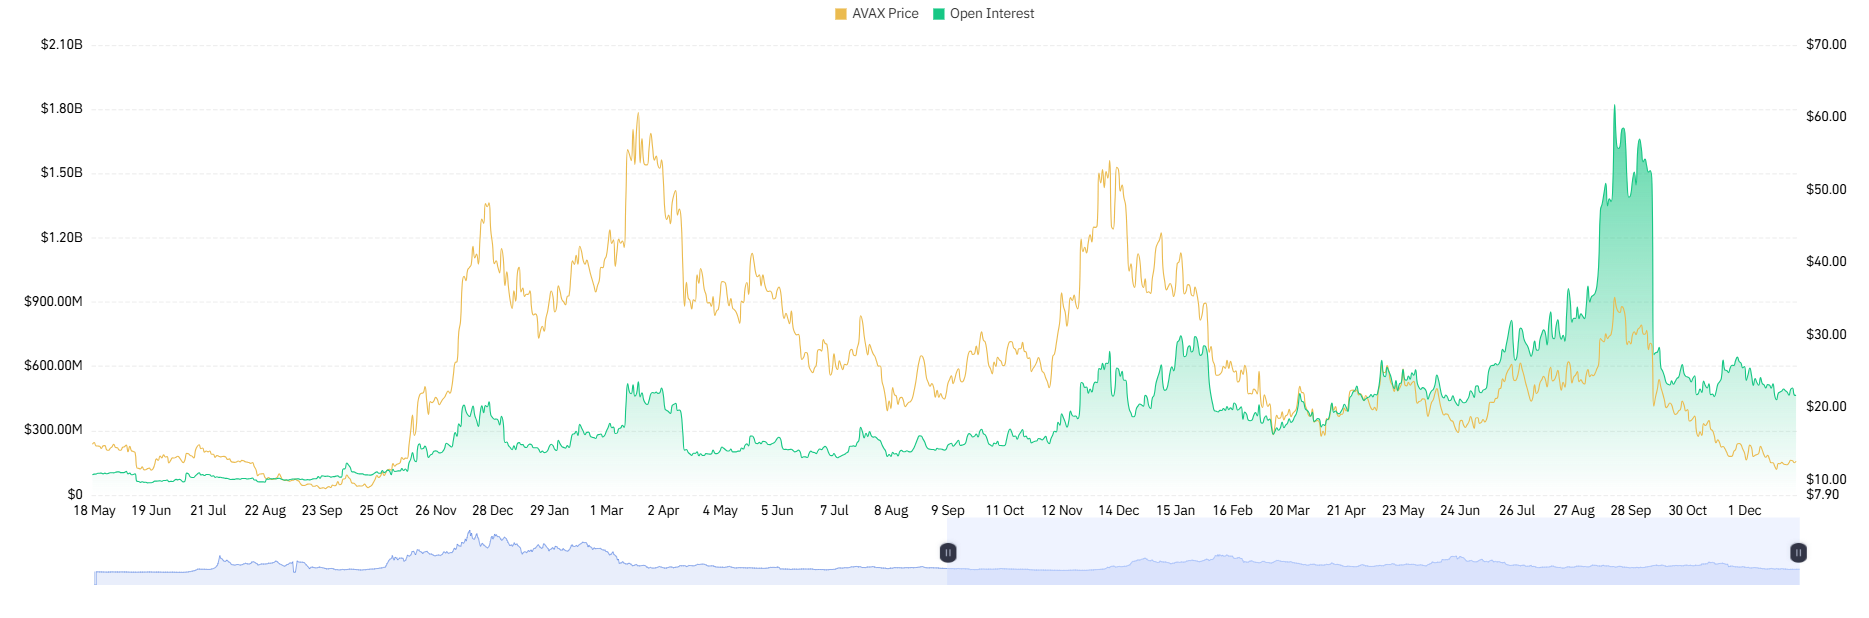
AVAX price cycles reveal leverage-driven rallies, Open Interest spikes, and deleveraging phases shaping the current market structure. (Coinglass)
Possible 2026 Scenarios
- Bearish Scenario: A drop below the support at $11 would indicate that prices would drop and fall into the range of $9-$10.
- Neutral Scenario: The price of AVAX will trade between $11-$15. AVAX will continue to build its accumulation range, therefore continuing on an upward path.
- Bullish Scenario: The price of AVAX is projected to move upwards if it exceeds a sustained monthly close of $20 and reclaims the RSI of 50. The upward target for the price of AVAX will be in the range of $30-$40.