
Key Insights
- Global liquidity hit record levels with major economies implementing stimulative policies, which helped improve capital for Ethereum.
- Ethereum was trading around $3,000 and was maintaining an ascending support, marking a point of stabilization while still being below key moving averages.
- US spot Ethereum ETFs recorded net outflows over the short term but remained strong in terms of cumulative inflows.
ETH Price Prediction Faces a Test Near $3,100 as Liquidity Rises
The globally available liquidity in markets has seen historic highs due to an expansion of stimuli from major markets, and presently, Ethereum is trading close to significant technical levels. The data, patterns on charts, and ETF trading activity also influence the ETH price forecast.
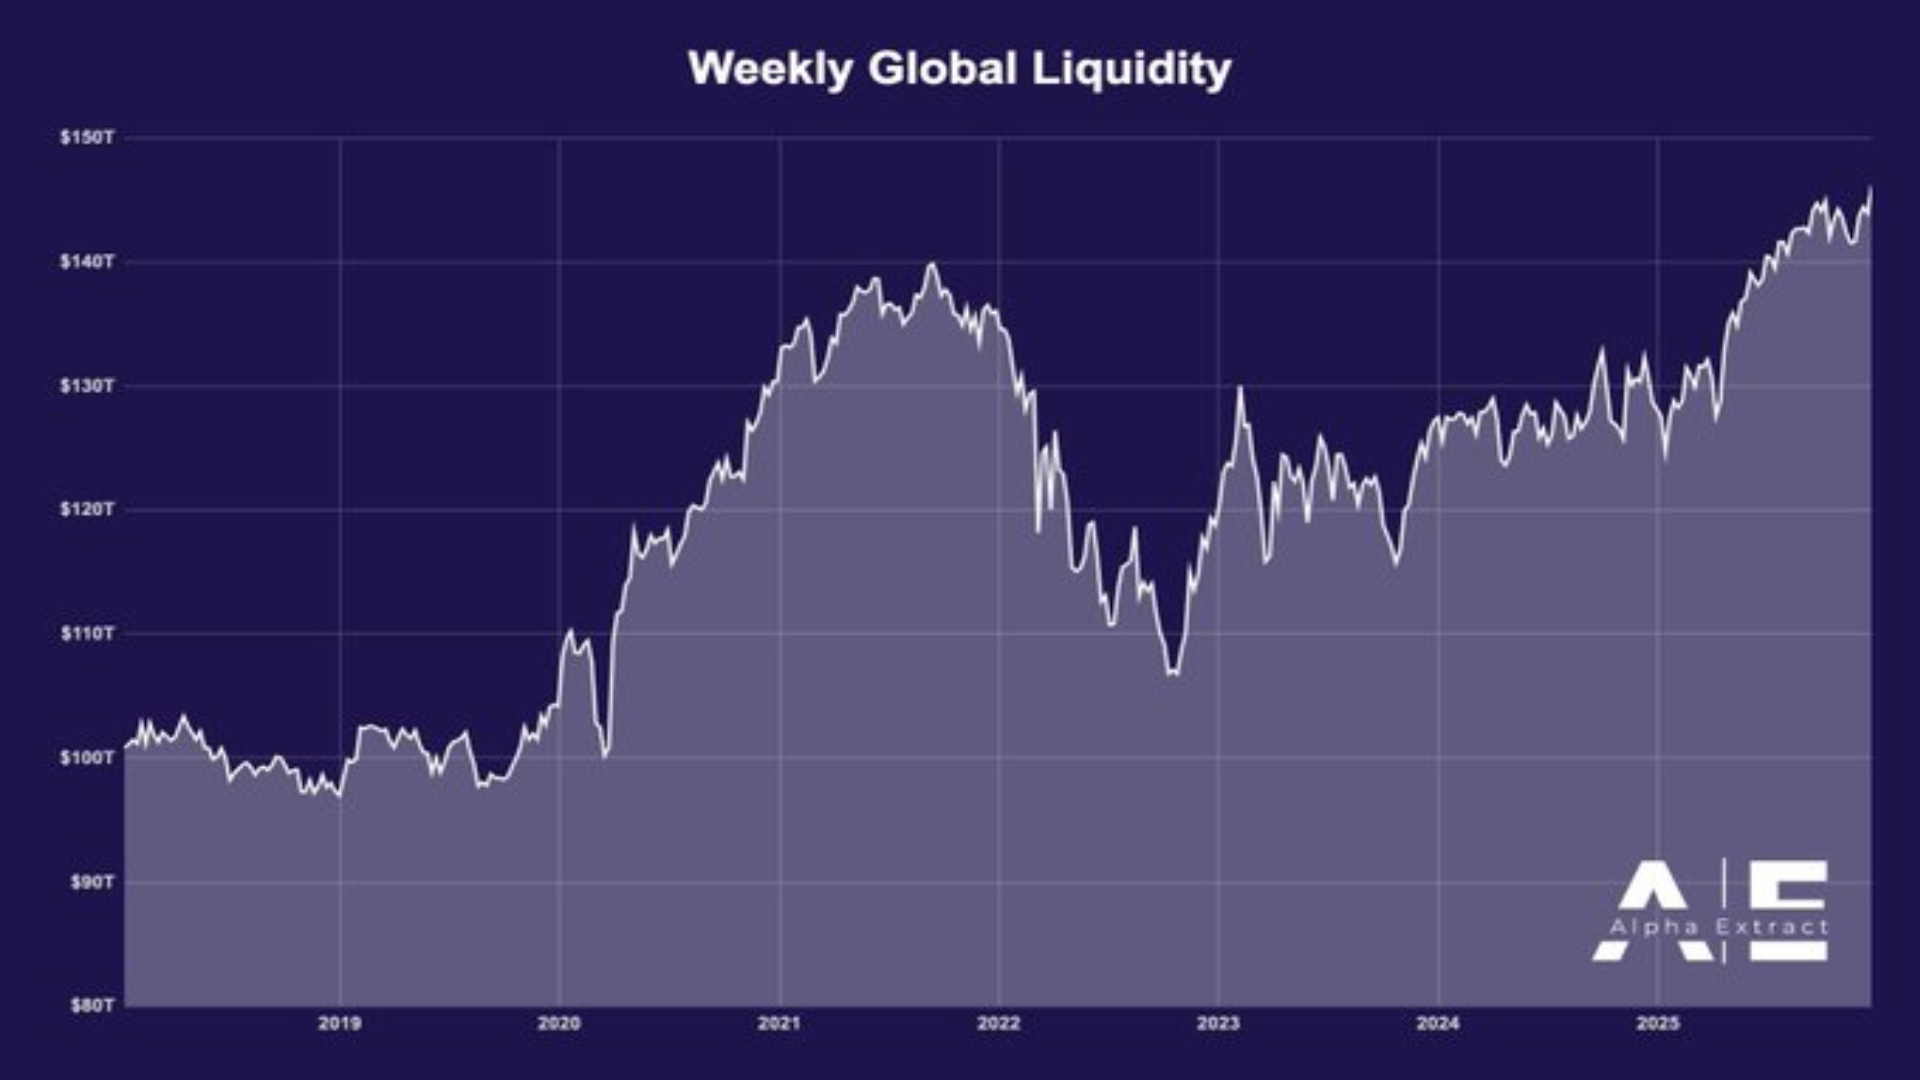
Global Liquidity Expansion Sets Market Context
According to Coin Bureau, global liquidity has hit an all-time record across all major economies. Countries such as China are adding a massive ¥1 trillion to their economies each week, while the US Federal Reserve is injecting approximately $30 billion.
Earlier this week, Japan approved a massive economic stimulus package totaling $114 billion, and New Delhi announced a $32 billion economic stimulus for businesses impacted by COVID-19.
These combined activities provide capital for investing globally. The growth of liquidity typically leads to increased levels of investment in risk assets, including cryptocurrency.
However, the price reactions of any cryptocurrency likely depend upon the existing market conditions of pricing, position size, and technical analysis. For example, while there is currently a high level of liquidity available for Ethereum, this has simply provided support to the price and does not suggest that the price is confirming the liquidity structure.
The price of ETH will continue to depend on how it behaves as it approaches different resistance levels. The presence of liquidity has not eliminated the potential for further price retraction based on the previous resistance zones identified for the ETH price prediction.
 Source: X
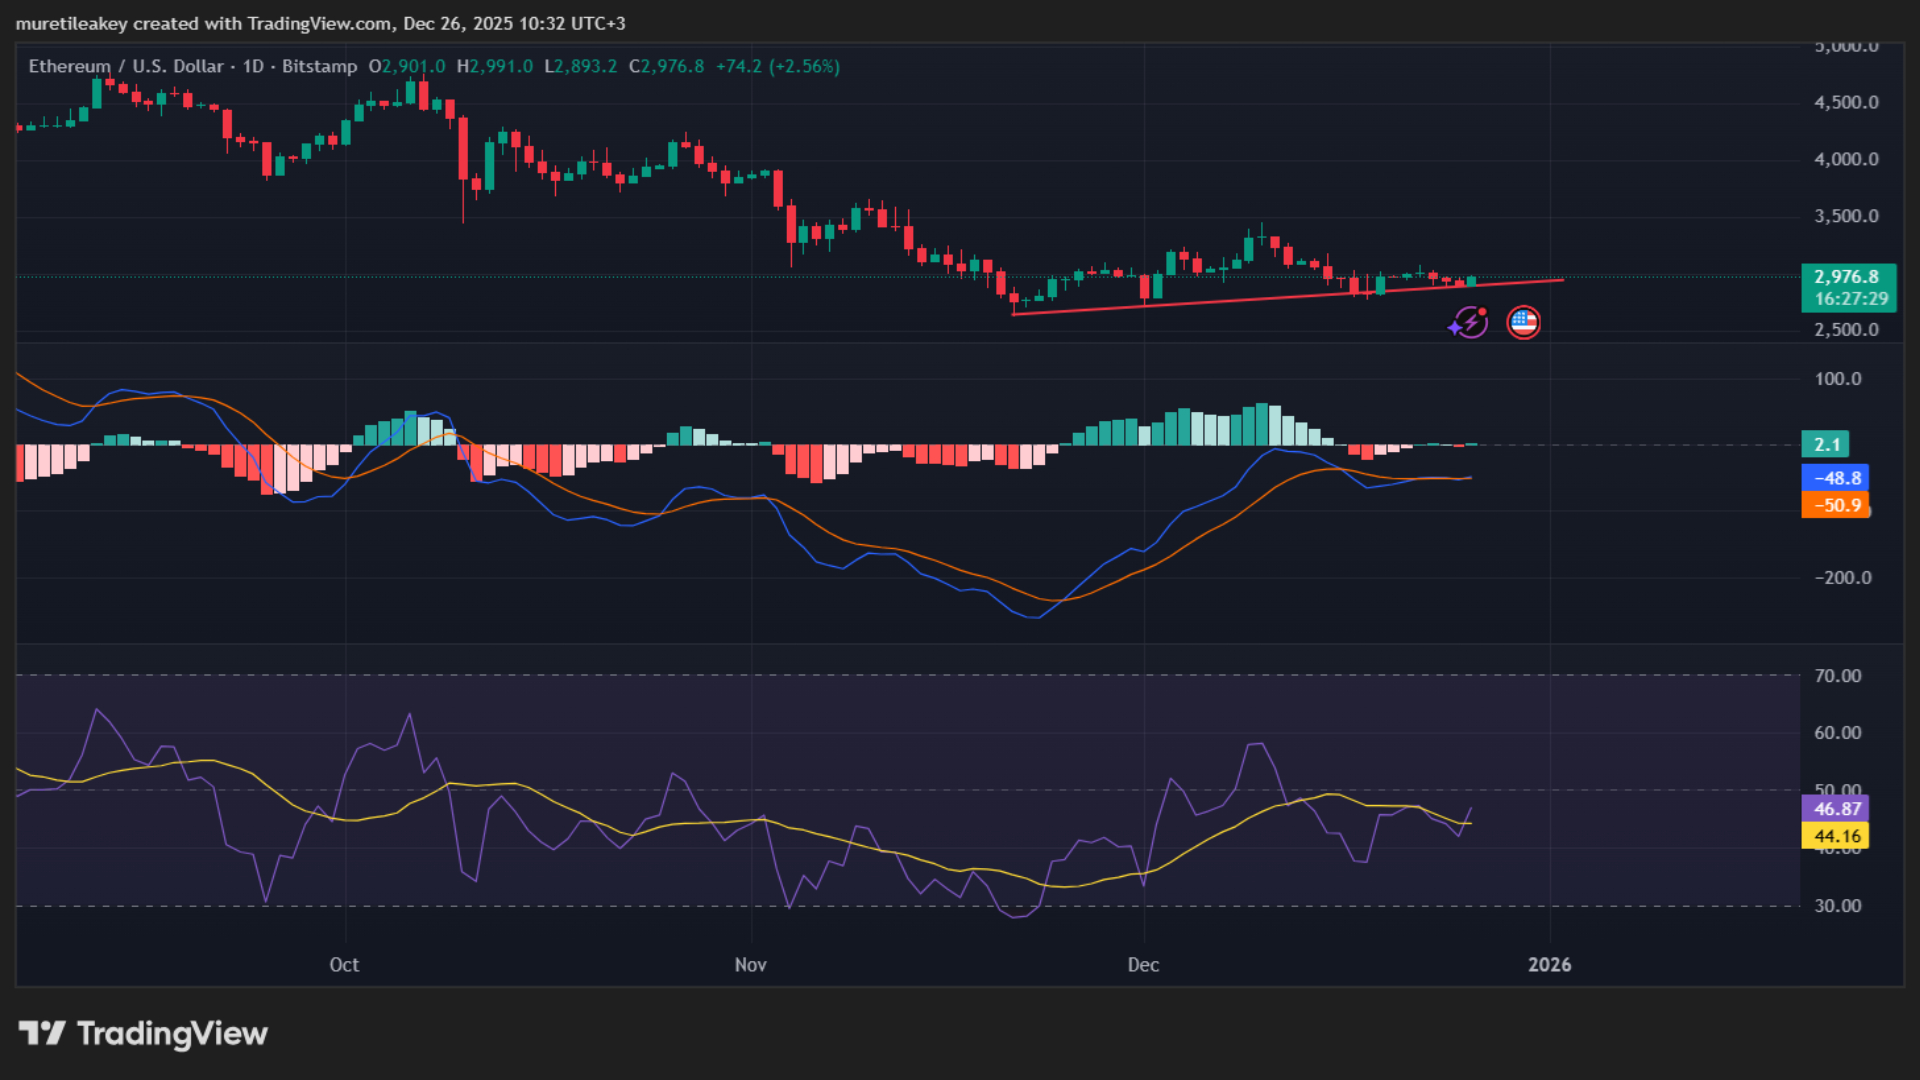
Ethereum Daily Chart Shows Base Formation
Currently, Ethereum sits just above $2,976, enjoying a daily increase of roughly 2.5%. Even though the price remains below the long-term bearish trendline established at around the $4,000-$4,200 region. December has demonstrated less selling activity compared to prior months due to decreased volatility.
The upward support line established in late November remains intact at the $2,800-$3,000 range. Candle sizes have become smaller, and more equal-size has decreased, and thus there exists a greater balancing force at the $2,888 area. Immediate resistance has formed at $3,050-$3,100, with strong resistance near $3,500-$3,600.
If ETH can hold above $3,100 on a daily close basis, this will continue to build momentum for higher prices. A daily close below $2,850 will break the upward recovery pattern, thus opening further downside risk for the ETH price.
Momentum Indicators Remain Cautious
Slight positive momentum is indicated in the MACD histogram; however, caution should be exercised as the MACD line still trades below the signal line. An MACD cross above the signal line will support bullish momentum.
The RSI has traded just below the neutral 50 level (47), having increased since its lows in November, indicating that there is less selling pressure now than at that time, although there is not enough bullish momentum yet to say that a bullish trend is underway.
The moving averages continue to support the balance of the price. Price is trading below both the 50-day and 200-day moving averages, which often cluster at the $3100-$3200 range for eth. This range is crucial for ETH price predictions.
 SOURCE:(TradingView)
Ethereum ETF Flows Reflect Portfolio Rotation
The US Ethereum spot Exchange-Traded Funds reported a historic net outflow of $52.7 million on December 24, yet still have total net inflows of over $12.3 billion. Trading volume of these Spot ETFs was also about $690 million on that day, which indicates active trading.
Both BlackRock’s ETHA and Grayscale’s ETHE saw daily net outflows except Grayscale’s Mini Trust, which experienced a slight positive inflow. The outflow patterns are consistent with what Coin Bureau wrote about and appear to support rotation and not an overall exit from the Ethereum ecosystem.
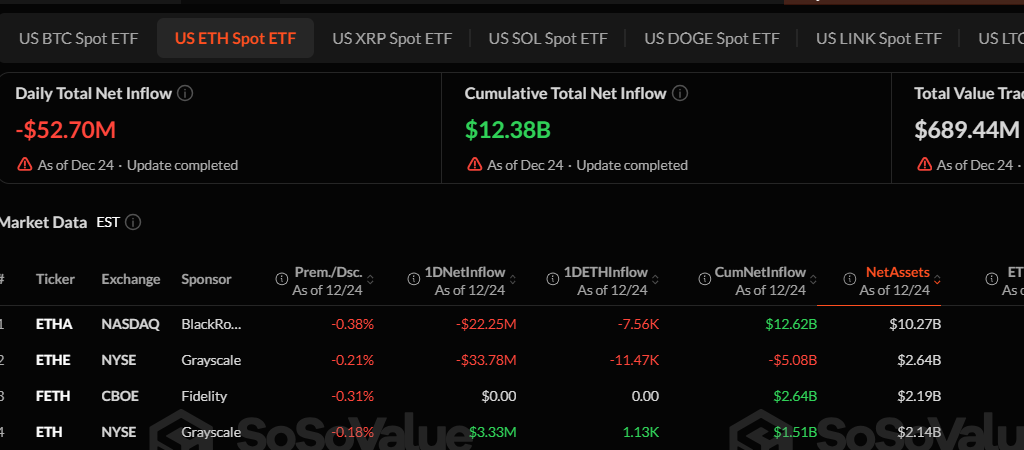
Ethereum spot ETFs see short-term outflows despite strong cumulative inflows, signaling institutional rotation rather than capital exit. (sosovalue)
The performance of ETFs indicates that ETH prices will stay consistent with expectations. Long-term investors are holding steady at current prices, while short-term movement appears to follow market sentiment. Thus, the ETF inflows and outflows show caution in assessing trends based on fundamental and technical analysis.