Key Insights
- Ethereum has stabilized at the $2,700–$2,800 support zone, where a cycle bottom and improving short-term recovery add odds for near-term market structure.
- Oversold stochastic oscillator readings are often a reversal phase signal; this reinforces the analyst’s view that selling pressure is fading and accumulation is returning.
- Analysts have outlined a bullish continuation potential if resistance is successfully reclaimed, with downside scenarios limited to the prior consolidation range.
According to multiple technical signals discussed by prominent market commentators, $ETH local bottom of $ ETH is in or very close. Recent price action shows Ethereum stabilizing after a sharp pullback. Momentum indicators are showing that selling pressure is easing. Historical patterns show that similar conditions preceded short-term recoveries and halted extended declines.
ETH Price Structure Signals a Potential Local Bottom
Ethereum’s price has been on a decline that landed it in a well-defined support area. This move triggered renewed attention from traders. The market tested the $2,700–$2,800 zone, which is a historically demand region during prior corrections. This reaction has slowed downside momentum and attracted incremental buying interest.
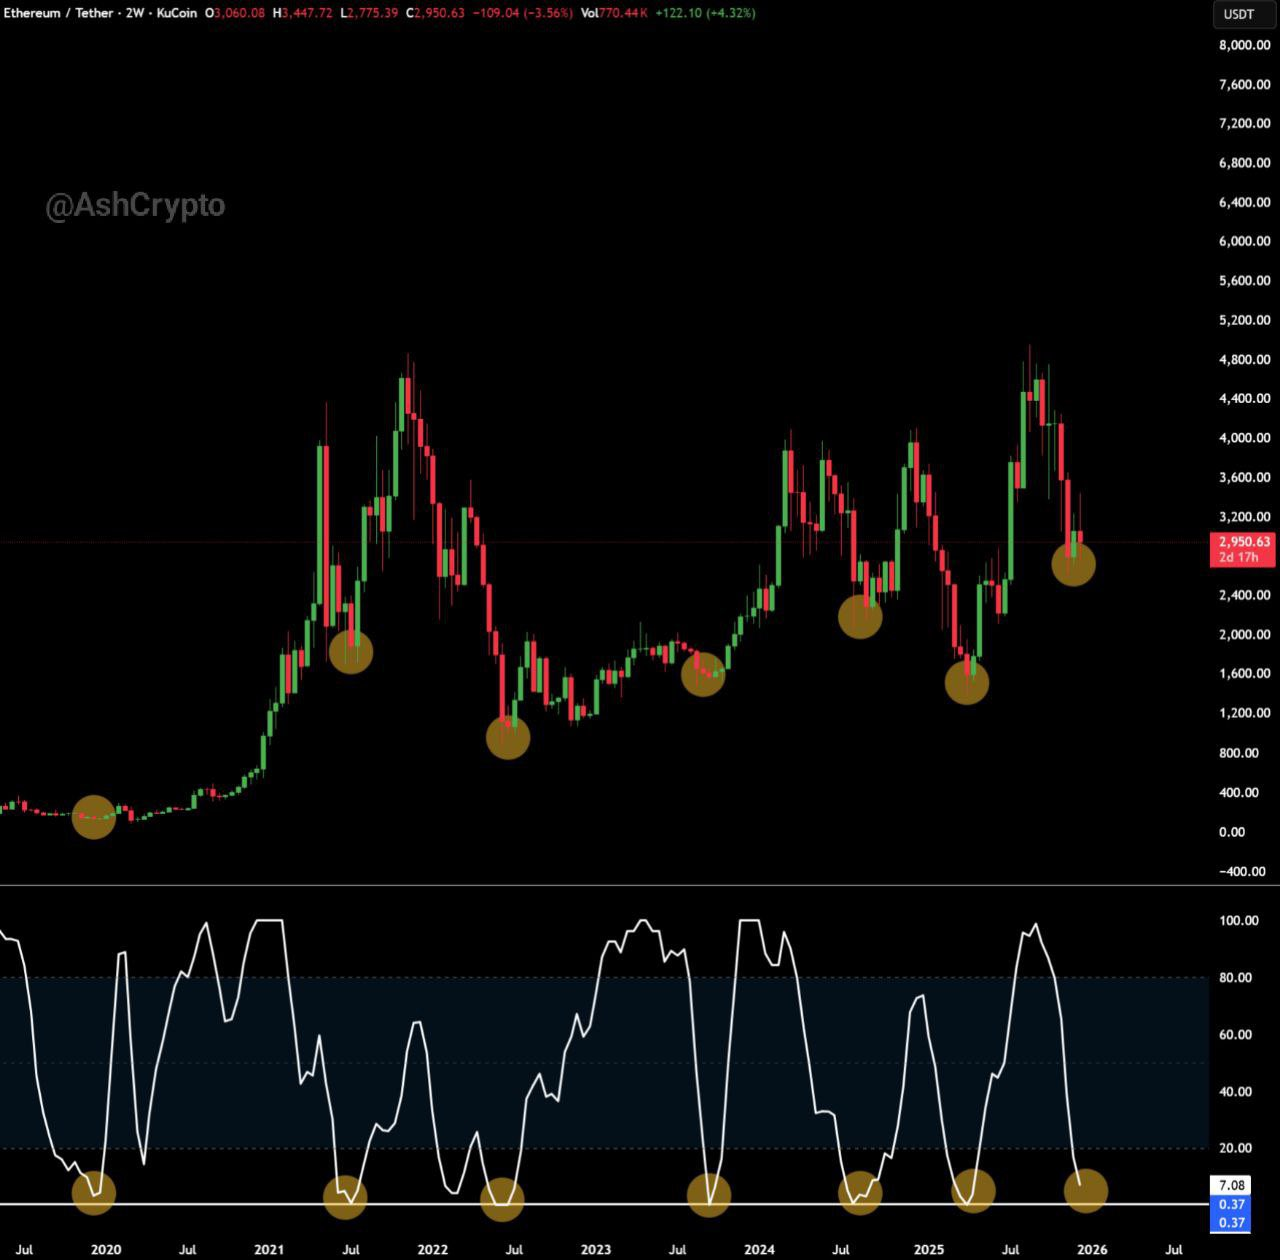
ETH USDT 2Week Price Chart | Source: X
Market structure shows repeated rebounds from comparable levels in past cycles. These rebounds follow after periods of strong volatility and sentiment fatigue. They typically emerge near local lows, rather than during trend accelerations or distribution phases.
Ash Crypto observed that recent behavior mirrors its prior cycle bottoms. In a post on X, the analyst emphasized how such declines were followed by stabilization. These movements often marked transition phases. The commentary framed the current zone as one where downside risk is narrowed. In spite of this, upside reactions have become more frequent.
Momentum Indicators Align With Historical Reversal Zones For ETH
Additionally, momentum tools are reinforcing the price-based observations. The Stochastic Oscillator on longer timeframes has moved into deeply oversold territory. In the past, these readings mostly appeared near market troughs compared to mid-trend pullbacks.
Usually, when the oscillator approaches its lower range, selling strength is already weak. However, this does not guarantee immediate rallies, but it often provides a base for upward structures. Ethereum’s previous major recoveries displayed similar momentum compression before the full trend reversal.
Ash Crypto’s analysis, connected with the oversold readings and prior accumulation phases, suggests that the market is nearing exhaustion on the sell side. Often, such alignment between price support and momentum conditions has coincided with local bottoms.
Key Levels Define Competing Short-Term Scenarios
Another chartered market watcher, Ted Pillows, outlined two near-term paths. This, however, depends on how Ethereum behaves around current levels. He noted that holding the $2,700–$2,800 zone keeps the recovery scenario active. Consequently, a sustained defense could allow the price to revisit the $3,100–$3,200 range.
https://x.com/TedPillows/status/2001941826916483365?s=20
Therefore, this bullish path depends on reclaiming former resistance zones. Acceptance above these levels will show that buyers are in control. Such moves will trigger short covering and improve market liquidity conditions.
However, Ted Pillows also cautioned that failure to hold support will change the outlook. A breakdown could lead to a retest of the $2,500 area consolidation base. Until resistance is reclaimed, both scenarios remain structurally valid within the broader market context.
In the meantime, the price of Ethereum (ETH) is $2,960.34 today with a 24-hour trading volume of $39,584,544,737. This represents a 3.58% price increase in the last 24 hours and a -8.63% price decline in the past 7 days.