
Key Insights
- XRP TD Sequential has flashed a buy signal that is signalling a potential short-term price rebound.
- XRP price is hovering near support inside the long-term trendline and is flashing mild bullish signals as selling pressure continues to fade.
- Intraday charts indicators are in a consolidation as bearish momentum weakens, and the TD Sequential buy signal signals a potential upside expansion in the near term.
XRP price is being closely watched by traders. This is after a widely followed technical indicator the TD pointed to a potential buying opportunity. Notably the broader market conditions remain cautious, as daily chart data suggest that downside momentum is waning. For now, traders are assessing whether this signal could align with support levels and start a short-term rebound.
XRP Price Signals Buy Setup on TD Sequentia
In a post on X, crypto analyst Ali Charts noted that XRP has triggered a buy signal on the TD Sequential indicator. The daily chart shows a completed “9” setup. This pattern is often associated with trend exhaustion after prolonged extended downside pressure. Analysts often view this as a signal that frequently preceded early reversal conditions.
The TD Sequential usually focuses on price structure rather than momentum oscillators. A “9” setup typically appears when sellers begin to lose control after a prolonged downward movement. Historically, such formations have constantly preceded short-term recoveries, and have provided support levels remain intact.
https://x.com/alicharts/status/2001915395247427751?s=20
XRP price is currently trading below the $1.87 level, and the chart structure have mapped the strong support near the S13 zone. Previously this area has absorbed selling pressure. The TD Sequential buy signal has reinforced the potential for a near-term bullish setup.
XRP Price Support Aligns With Long-Term Structure
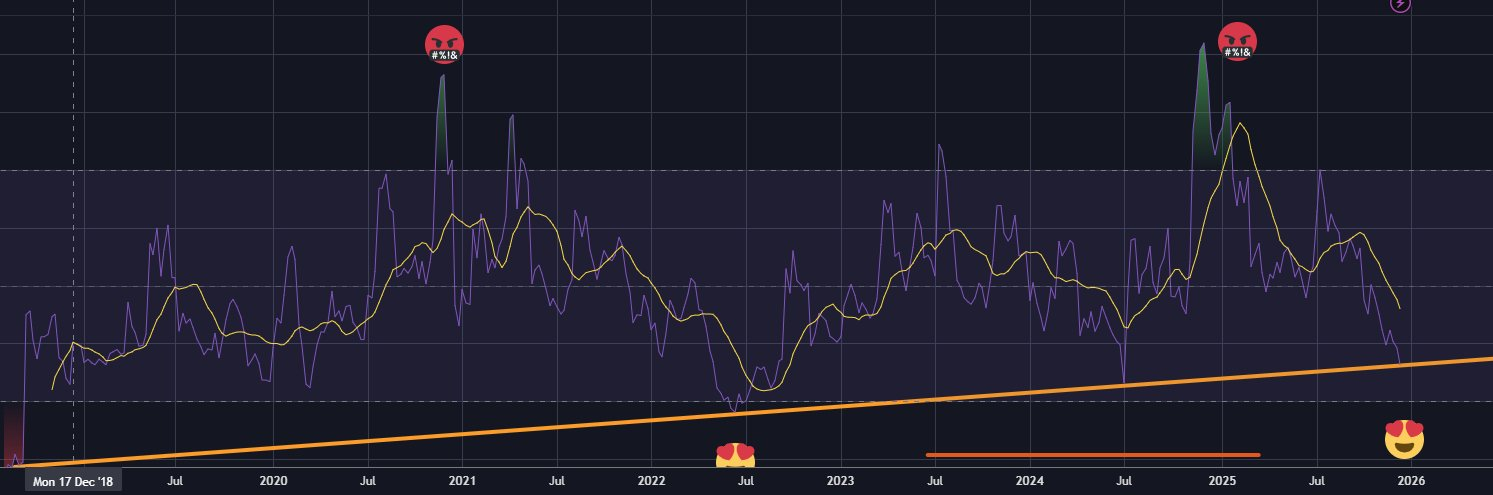
XRP price has continued to respect its long-term ascending trendline that has spanned from late 2018 to late 2025.Additionally it has served as dynamic support during multiple corrective phases. Therefore as long as the price remains above this structure, the broader market bias remains constructive.
 XRP Long Term Trendline Indicators | Source: X
Analysts are speculative that this long-term support could present a corrective pause that could invalidate a trend failure. Historically, pullbacks toward the established trendlines attracted renewed market demand. This context strengthens the relevance of the current TD Sequential signal.
While XRP price remains below the $1.97–$2.00 resistance zone, technical indicators are signalling a slow down in selling pressure near support. The inability of bears to force deeper breakdowns has kept the market in a compression phase as bulls try to reclaim new directional moves.
Intraday Indicators Reflect Stabilization Near Buy Zone
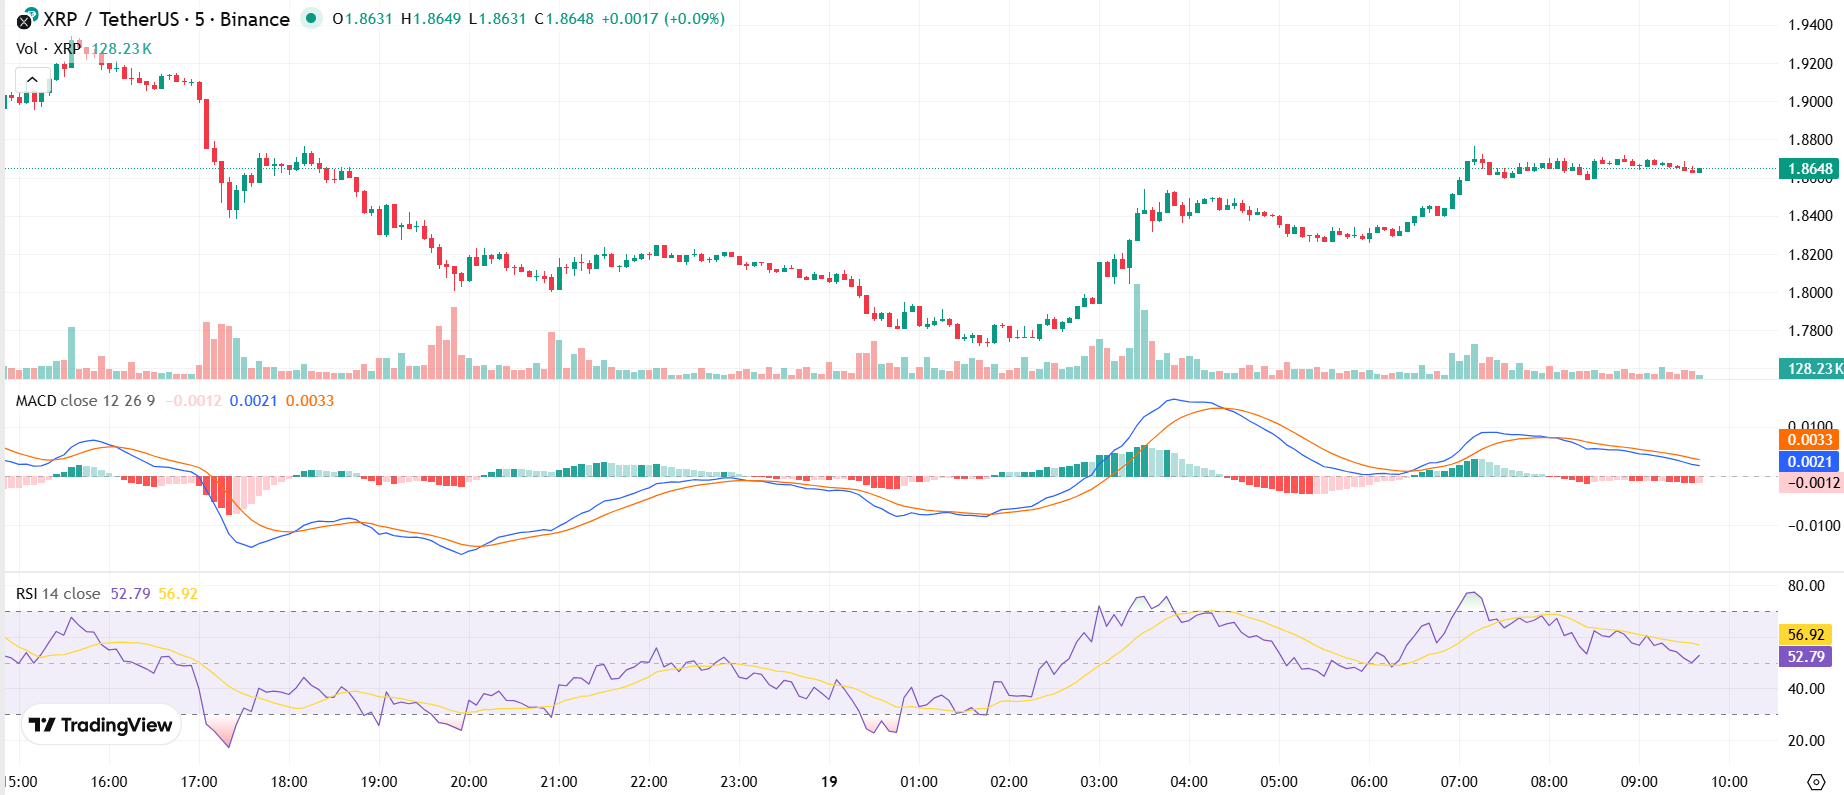
On lower timeframes, XRP remains consolidated after a prior advance toward $1.87 that was rejected. Price action has since then shifted into a narrow range, indicating a balance between buyers and sellers. This behaviour typically precedes short-term expansion after exhaustion of bear signals.
XRP Price Short Term Price Charts | Source: X
In addition, momentum indicators are showing mixed but stabilizing conditions. The MACD is below its signal line, and the shrinking histogram suggests that bearish momentum is weakening. This furthermore supports the view that selling pressure is gradually losing strength.
The RSI is holding near neutral levels around 60.This conditions has left room for renewed upside without entering the overbought conditions. Holding above the $1.82 area would maintain the current consolidation. The TD Sequential signal setup shows that the price is approaching a favourable buy zone.


Good day I am so excited I found your webpage, I really found you by error, while I was searching on Google for something else, Regardless I am here now and would just like to say kudos for a tremendous post and a all round enjoyable blog (I also love the theme/design), I don’t have time to go through it all at the moment but I have bookmarked it and also added in your RSS feeds, so when I have time I will be back to read a great deal more, Please do keep up the superb work.
Thanks
I really like your article.
Hit me up! It’s like you read my thoughts! It’s like you read my thoughts! Very nice article!
You are obviously very knowledgeable.