

Key Insights
- On the four hour chart Dogecoin price has formed a falling wedge pattern that is signaling weakening of selling pressure in preparation for an upward move.
- On the monthly charts Dogecoin is approaching the $0.10 target and the $0.062 historically strong support level is attracting a significant buying interest.
- Binance data reveals a dominance by long position, an indication that traders are confident in potential short-term market gains.
Dogecoin price trades at $0.1351 today after a 3.11% drop in the past 24 hours. Trading volume has remained high with $590 million intraday volume. Overall ,DOGE has declined 2.11% over the past week as weak short-term momentum persists.
A falling wedge technical structure is forming on the four-hour timeframe and the price is compressed. Analysts suggest this structure may lead to a breakout that could potentially lead to a test of key support levels near $0.10 and $0.062.
Dogecoin Price Forms Falling Wedge on Short-Term Chart
Through a post on the social media platform X Trader Tardigrade highlighted a four hour Dogecoin price chart. This chart shows that the coin is currently forming a falling wedge. This pattern shows that the price remains contained between two downward-sloping, converging trendlines. The structure is showing signs of decreasing selling pressure.
Within the wedge, each decline produces smaller lows. This is reflecting a gradual loss of bearish momentum. The lower trendline is flattening faster than the upper one. This therefore shows that volatility is contracting as the crypto approaches the wedge’s apex.
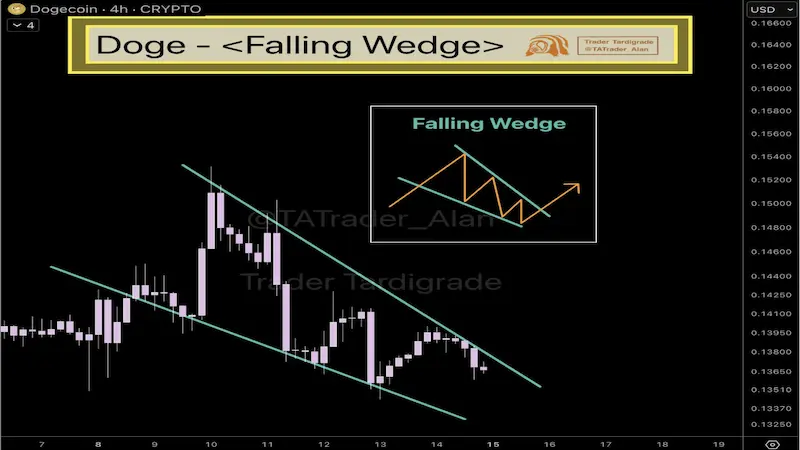 DOGE 4H Price Chart / Source: X
Falling wedges are typically considered bullish, however,Dogecoin price could technically remain bearish until a decisive close above the upper trendline occurs. A decisive breakout here would indicate that buyers are gaining control.Inturn this could trigger a short-term upward move.
Key Support Zones Could Stabilize Dogecoin
Chartered market analyst Ali Martinez shared a long-term price chart. The analysts’ projections suggest that Dogecoin could find support around $0.10 and $0.062. These are historically significant demand zones where buyers previously entered the market and halted further declines.
Previously, the $0.10 area has acted as both resistance and consolidation zone. Therefore, the current weakness in the mid-range is increasing the likelihood of sellers pushing Dogecoin toward this zone. Additionally, if the price holds, buyers could join the market and defensively counter selling pressure to prevent further downside.
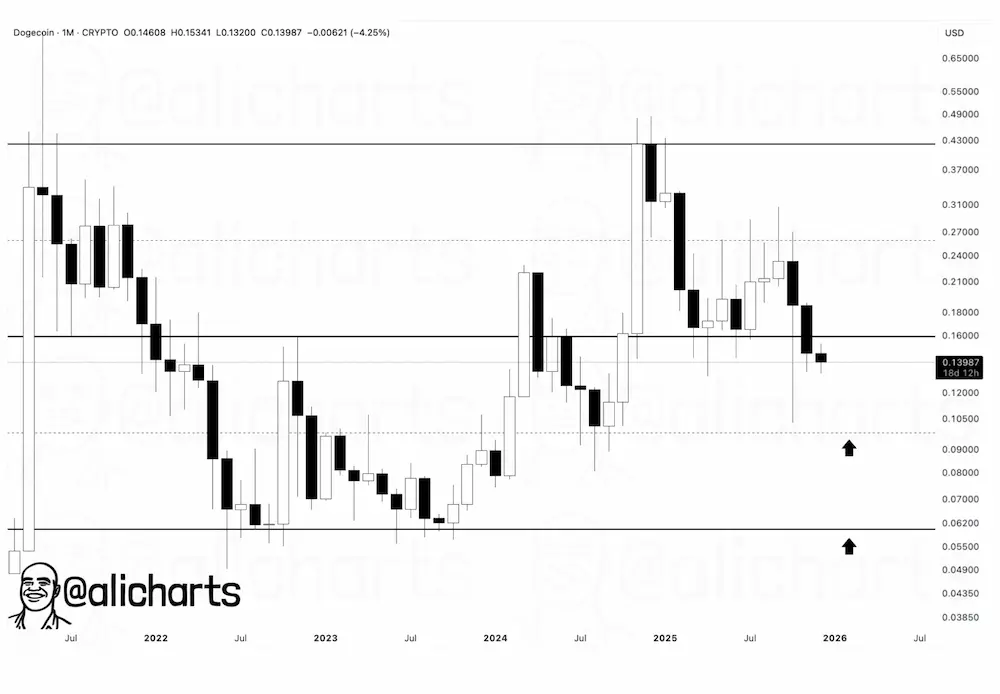 DOGEUSDT IMonth Price Chart / Source:X
Failure to maintain $0.10 could open the door to $0.062, a cycle base that marked the exhaustion of selling pressure in the past. In past cycles liquidity often pooled near this level, and this makes it a focal point for a potential rebound.
Market Sentiment Suggests Fragile Positioning
Binance’s Top Trader Long/Short Ratio shows that most accounts are long. However, despite this their conviction is weakening and traders are just holding positions but are no longer adding aggressively.
This hesitation shows cautious optimism from traders.In the meantime, fewer accounts hold larger amounts of Dogecoin.This therefore means that the concentrated positions could increase risk in case of a further price drop.
Dogecoin sellers and buyers appear to be in some kind of tag of war as they battle for dominance.Short-term price action shows a controlled decline rather than panic selling.
Lower highs, muted volume, and steady exits indicate caution. Dogecoin price remains at a critical point. How market participants react at these key support levels will determine the next directional move for DogeCoin.


