Key Insights
- On the daily chart AAVE has formed a descending broadening wedge that is showing potential for a breakout toward $350.
- Price is consolidating near $205, volume and MACD patterns are indicating that buying pressure is building.
- Aave’s TVL exceeds $40 billion, fees reach $14.4M,a demonstration of a deep protocol adoption across the DeFi ecosystem.
Aave trades at $205.50 after a 7.92% daily rise as buyers push fresh momentum into the market. The token has gained 8.80% this week, reflecting stronger confidence in its key breakout structure as price tests major resistance. Growing volume and steady accumulation signal rising interest as Aave builds toward a possible rally in the coming days.
Aave Daily Chart Hints at Strong Bullish Breakout
AAVE price structure has formed a descending broadening wedge on the daily timeframe. This pattern is often associated with bullish reversals. Throughout the downtrend the price respected both support and resistance lines. However, the recent candles are showing strong upward momentum as they test the upper boundary of the wedge.
Momentum indicators are suggesting there is a growing buyer interest, higher lows and larger bullish candles are signalling declining bearish pressure. A breakout above the descending resistance could open the door for a move toward the $350, a target that aligns with the projected height of the wedge.
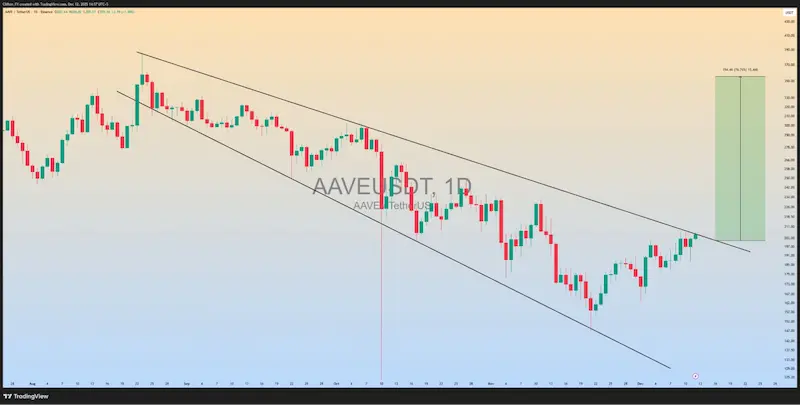 AAVEUSDT Price Chart / Source: X
Analysts are cautiously waiting for a confirmed close above the trendline and an increase in volume. If bulls are rejected at the resistance this could result in a retracement toward mid-wedge levels. Volatility has remained high during the breakout attempts,and this is making confirmation critical before further gains.
Bullish Intraday Momentum and Volume Patterns
AAVE steadily rose upward and then consolidated around $205 ,forming bullish candles due to the expanding strong buyer volume and participation. Momentum has eased around the $205–$207 range after a tight intraday battle between buyers and sellers.
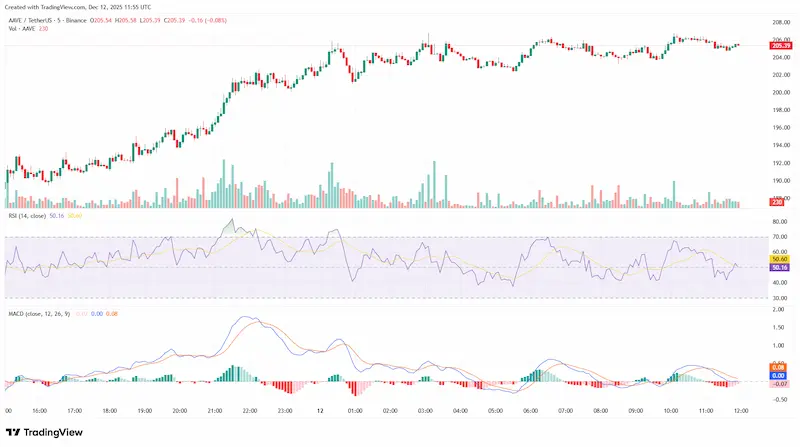
AAVEUSDT 5 Mins Price Chart / Source: CryptoRank
The RSI now sits near the neutral 50 level, following earlier swings into both overbought and slightly oversold territory. The inability to hold above 60 signals reduced bullish intensity. Notably, MACD lines are converging near zero, histogram bars shrunk and briefly turned red, this is suggesting indecision by market participants.
Compared to earlier surges , volume decreased notably. Ongoing market activity appears to be consolidating, and traders seem to be awaiting for a new market catalyst to trigger a breakout. Traders are closely watching to see if volume will recover, because this be a sign of renewed volatility.
Aave DeFi Metrics Show Strong Protocol Demand
In the DeFi ecosystem AAVE has continued to show strong fundamentals. Whale activity has increased notably, a whale 0xE9D0 borrowed 1M USDC so as to acquire 5,211 AAVE.The whale now holds 338,544 AAVE while carrying $30.8 million in USDC debt, showing how actively leverage is used on Aave. This bold move shows that interest in the protocol remains strong.
Aave’s Total Value Locked moved past $40 billion as users continued adding liquidity. This rise set a new all-time high for DeFi lending. Fee generation reached $14.4 million, placing Aave third among major DeFi projects;revenue has stayed at $1.75 million, reflecting steady usage and solid activity on the platform.
These fundamentals have maintained its role as a core DeFi infrastructure layer as cross-chain support keeps growing, and user trust strengthens its position in the market. The GHO rollout and other upcoming upgrades are expected to attract more liquidity and further growth.