
Key Insights:
- December’s mild decline contrasts with Red November’s steep drop, raising interest among traders studying seasonal behaviour and waiting for momentum to stabilise.
- Bitcoin is retesting a major breakout zone and this is creating attention on whether buyers can defend support and shift market direction upward.
- Daily analysis has noted a tight trading momentum between key levels, this trend of development is as Bitcoin tests demand zones eyeing a potential Red December recovery.
After a deep red November, red December’s mild weakness is giving signals of a potential rebound. This has caused unrest among traders and they are closely watching key support zones for any signs of renewed upward momentum.
Bitcoin (BTC) trades at $90,324.78 today after slipping 1.89% in 24 hours extending its weekly losses to 2.84%. Daily trading volume hit the $55 billion volume mark and is defying typical seasonal trends.
Why Red November Red December Is Not Playing Out as Expected
Crypto Patel noted that Bitcoin closed November with a sharp –17.67%, a reading that would normally set the stage for deeper losses in December. He explained that many past cycles showed the market extending November’s direction, yet 2025 has not followed that rhythm.
He added that December is currently down only –0.64%, creating a different picture from years when early declines accelerated throughout the month. Historical data showed December carrying strong average performance, offering seasonal strength that contrasts with current hesitation.
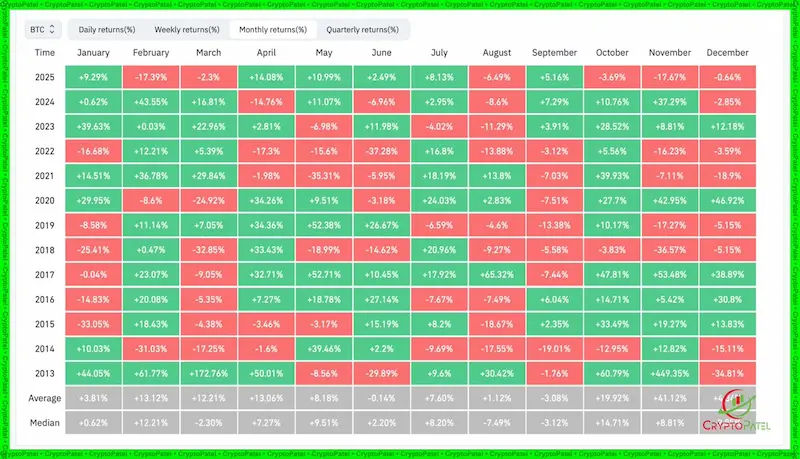 Bitcoins Monthly Performance Data / Source : X
Patel also mentioned that earlier cycles showed how deep red months sometimes came before recovery phases. With November already delivering heavy selling, traders are watching whether recent pressure has created room for a stabilising move.
Chart Structures That Could Break the Red December Pattern
Crypto Faibik described an 8-hour breakout where Bitcoin moved above a descending channel before pulling back to retest the structure. He noted that this behaviour often marked transitions from correction to expansion.
Multiple shakeouts near resistance added uncertainty as both buyers and sellers were displaced. He projected a dip into the mid-$80,000 area as part of the retest, stating that a solid base there could open the path toward $96,000.
That level remains the threshold he believes would allow buyers to strengthen control.His chart extended toward higher targets if the retest held, but he emphasised that each step depended on maintaining recent higher lows.
This setup created interest among traders watching for signs that the pattern may break away from the Red November Red December narrative.
Support Zones That Could Decide the Red December Outcome
Daily analysis showed Bitcoin struggling to reclaim the $93,000–$94,000 band. Observers pointed to $88,000–$89,000 as a major short-term support that may guide direction. Holding this area could allow renewed attempts at the upper ranges.
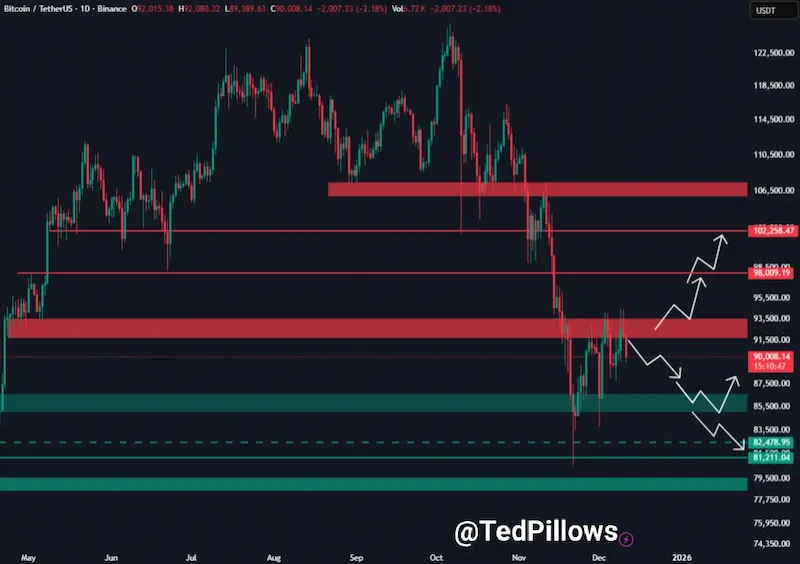 Bitcoins 1 Day Price Chart / Source: X
Analysts expect a move toward $85,000 if the price falls below $88,000,deeper pockets of demand hold strong between $79,000 and $83,000. These levels have established themselves in the broader structure and traders are monitoring them for confirmation of momentum shifts.
Short-term intraday data shows a strong selling spree followed by a consolidation around $90,000. A recovery above $91,000–$92,000 would help stabilise movement and offer a clearer view of whether December will stay red or move toward recovery.