
Key Insights:
- BTC liquidity heavy sell zones are near 92k–96k where selective whale accumulation is shaping a tightening range in the recent market movements.
- Price is moving inside a descending channel as Bitcoin builds higher lows challenging the weakening 93k resistance.
- Exchange balances continued falling as whales accumulated over 47,000 Bitcoin, reinforcing a steady supply drain in the broader market structure.
Bitcoin trades at $89,539.92 today as its 24-hour volume reaches $47.99 billion. The price is down 1.85% on the day and 1.12% over the week. Market activity shows mixed signals as liquidity shifts and whales adjust positions. Resistance levels and declining exchange supply are giving direction.
Whale Activity Adds New Tension to Bitcoin Liquidity
BTC liquidity behavior shared by CW shows a market caught between heavy sell zones and concentrated buy support. Heatmap indicates a consistent sell-side liquidity stacked between 92,000 and 96,000 USDT. This area has formed a ceiling that has regularly stopped upward price attempts.
A supportive cluster of buy orders has formed between 84,000 and 86,000 USDT and has helped to prevent a deeper breakdown.This steady outflow kept BTC pinned in a narrowing range. CW notes that this broad selling creates persistent downward pressure, slowing any attempt at recovery.
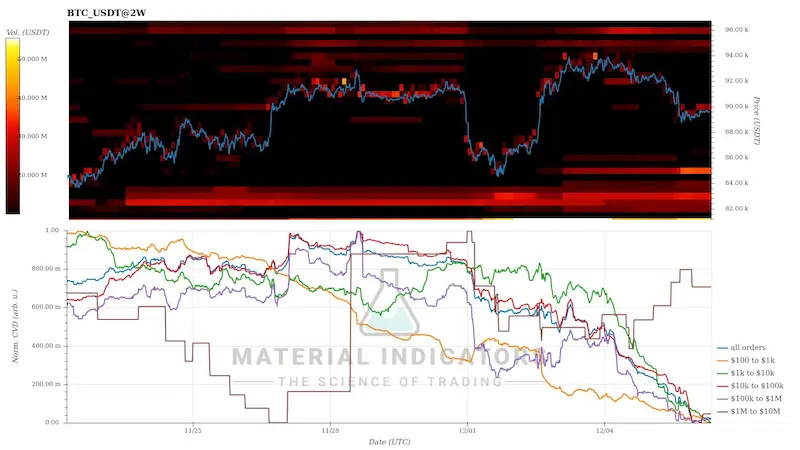 BTC USDT 2week CVD Chart / Source: X
However, only a specific whale segment—brown whales—is still accumulating during the recent decline. This selective buying contrasts sharply with the aggressive selling seen from the largest whale group, whose declining CVD line signals ongoing distribution. This mixed behavior has contributed to the recent compression and momentum loss.
Bitcoin Edges Toward a Breakout-Level Battle
Captain Faibik says bulls are still struggling to break the 93,000 USDT resistance. His chart shows BTC moving inside a broad descending channel on the four-hour chart. The pattern looks like a falling wedge, which can sometimes point to a trend change when selling pressure slows down.
BTC recently bounced from the lower edge of the channel and is now trying to form a higher low, a sign that the market may be gaining strength. Consequently , this move has pushed the price toward the middle of the channel. Traders are watching to see if buyers can hold their ground around this zone.
Analyst Captain Faibik noted that if BTC breaks above the channel’s upper trendline with strength, it could lead to a larger upward move.
According to his projection , the next target level is near 125,000 USDT. Although such a move would require sustained volume and stability above key resistance zones. Until then, the structure remains incomplete and dependent on buyer follow-through.
Supply Flow Trends Strengthen the Long-Term Bitcoin Narrative
Rand notes that more than 25,000 BTC has moved off exchanges in two weeks, extending a long-term decline in available exchange supply. Over the past year, balances on major platforms have fallen from above 3 million BTC to near the 2 million range.
The slow and steady shift shows more BTC moving into long-term storage. These outflows lower the amount of BTC available to sell, which affects how price reacts when demand picks up again. The trend has stayed mostly consistent, suggesting that holders are comfortable keeping their coins off exchanges.
Max Crypto notes that whale wallets holding 10–10,000 BTC have added more than 47,000 BTC in the past week. This is a clear change after a long period of selling. As smaller wallets reduce their holdings, whales seem to be taking in that supply, creating a tighter market that traders are keeping an eye on.