
Key Insights:
- Bitcoin’s experienced an intraday sharp sell-off that pushed price into dense liquidity zones before order flow began forming early signs of short-term market balance.
- Bitcoin buy orders took in the selling pressure, while stacked sell orders kept any rebound limited within the narrow intraday range.
- Whale activity added Bitcoin near critical liquidity floors and took the opportunity to buy the dip.
Bitcoin recorded a sharp intraday decline that pushed the market into a steep correction before stabilizing above major liquidity levels. The drop forced traders to reassess the short-term structure. This as price moved from heavy volatility into cautious consolidation.
Steep Intraday Breakdown Pressures Short-Term Structure
Bitcoin fell abruptly from the mid-$88,000 region into the low-$85,000 zone after a tall red candle signaled aggressive selling. The decline interrupted a long stretch of steady movement, indicating that large orders or liquidations triggered the move.
After the breakdown, the chart showed smaller candles, which signaled that selling pressure was easing and buyers were beginning to test the lower levels. The oscillator continued to show strong downward momentum during the collapse.
A deep red wave appeared before slowly turning upward while price stayed almost flat. The move created a mild bullish divergence as bullish momentum slowed and volume dropped during the stabilization phase.
This usually happens after sharp declines because larger traders pull back once the fast selling ends. Bitcoin stayed above the low, but the rebound remained limited compared to the earlier drop.
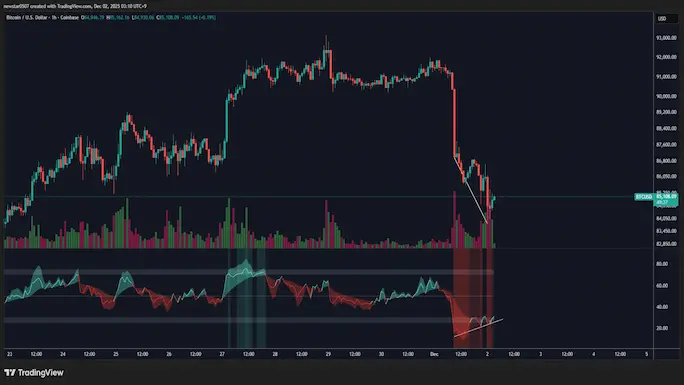
Bitcoin 1Hour Chart / Source: X
The structure remained neutral, and traders waited for either a breakout or another test of liquidity.
Liquidity Clusters Shape BTC’s Short-Term Behaviour
Crypto analyst TedPillows noted that Bitcoin formed notable liquidity clusters between $83,600–$83,800 and $86,500–$87,000. He explained that a sweep of lower liquidity levels could occur before any durable rebound.
The order book heatmap showed thick yellow and teal bands under the price as it moved lower, indicating buyer bids waiting to take the drop. During the sell-off, the price briefly dipped into one of these heavy liquidity areas before moving back up.
This showed that large buyers or trading systems were stepping in to absorb the selling pressure. As Bitcoin attempted to bounce back, big sell orders appeared between $85,000 and $86,000, forming a strong resistance zone.
The market then settled into a narrow range in the liquidity floor between $84,000 and the overhead sell orders. Price stayed confined in this tight channel while traders watched these key levels closely.
The next move will depend on whether buyers or sellers take control of these clusters.
Market Dump Draws Attention as Whales Accumulate
December 1 illustrated a sharp collapse from near $92,000 into the mid-$84,000 range before transitioning into slow sideways movement. The decline accelerated quickly due to the forced selling or liquidations, especially as rebound attempts failed during the initial fall.
Bitcoin formed a shallow basin in the mid-$84,000 zone. Attempts to rally repeatedly stalled around $86,000 before fading, showing hesitation from buyers. Later, the price dipped again just above $83,000, where it was quickly absorbed.
The bounce that followed remained weak, and Bitcoin ended the session between $84,000 and $85,000.Despite the broader weakness, whale activity remained evident. One strategy added 130 BTC worth $12 million, raising its holdings to 650,000 BTC.
To add to the bullish sentiments , another major holder purchased 77,385 ETH worth $212 million. These accumulations occurred during the decline, suggesting that large entities continued expanding positions as the market faced one of its sharpest drops in the recent weeks trading sessions.