Key Insights:
- The ZEC Zcash ETF filing arrives during a sustained downtrend with compressed support, creating renewed interest within a weakening market structure.
- Key levels include the $455 support zone and the $350–$370 demand area as price action continues to show steady pressure.
- Market-cap movement reflects early strength followed by gradual decline, aligning with the broader trend that is showing on the ZEC charts.
ZEC Zcash has continued drifting lower despite the recent Grayscale filling of a ZEC ETF . Price charts are showing weakening momentum, compressed support levels, and a steady decline in overall market strength. Analysts are of the view that ZEC could continue drifting lower as cautious mood spreads across the market .
Grayscale’s Filing and Market Sentiment
ZEC has been on a persistent sequence of lower highs across the mid-$450 range. The coin has continued to drop significantly over the past seven days . This is despite a market buzz caused by a filling made by Grayscale seeking an ETF spot.
Some analysts were speculative that renewed interest might emerge during a clear downturn. However market reaction stayed controlled, though the presence of the ETF headline added a new element to the ongoing discussion.
At the same time, analysts emphasized that ZEC remained below the Koala Cloud on the 4-hour chart. The cloud’s widening and downward curve illustrated a reinforced bearish environment.
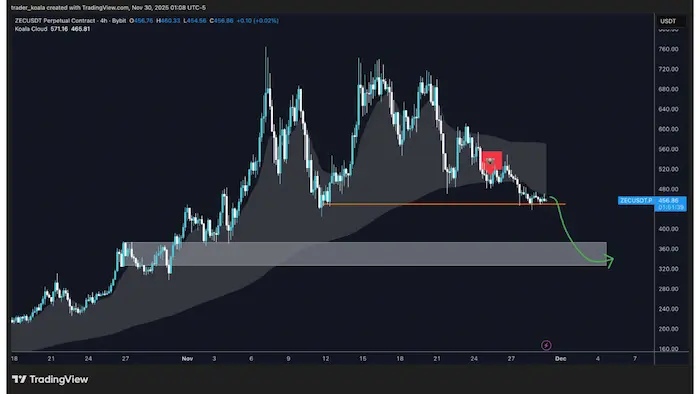
ZEC 4 Hour Price Chart / Source: X
Even with the filing in the spotlight, traders maintained focus on the structural signals showing steady pressure from the sell side. Throughout the trading session, price behavior consistently continued a broader decline.
Momentum weakened after multiple failed attempts to establish higher levels, and buyers showed only brief strength before momentum faded again.
Technical Structure and Key Price Zones
ZEC has continued to press lower after rejecting the cloud’s upper boundary, and the chart illustrates a clearly failed bullish attempt. This failure points to the steady strength of sellers. Especially as multiple retests of the $455 support zone resulted in flattened candles and reduced volatility.
The support zone remained the focal level for short-term traders. Therefore, if sellers push prices below this region sellers could push prices towards the $350–$370 demand area as the next logical floor.
This zone served as a strong base before the early November breakout, and this made it a structurally relevant area for support. Still, analysts are monitoring the possibility of limited bounces while if the price holds the current support line.
On that note, a meaningful recovery requires a break above the lower cloud boundary, however, the recent attempts lacked conviction. Market conditions therefore continue to favor sellers unless buyers deliver a clear reversal.
Broader Trend Conditions and Market-Cap Behavior
Both higher-timeframe readings and lower timeframes confirmed the shift, displaying lower highs and lower lows with only short-lived counter-moves. Even with the ETF filing entering the conversation the market seemed to be entering a cooling period.
In the last 24-hour window, market-cap data displayed moderate volatility. An early rally pushed valuations toward the upper end of the $7.6B range, however buyers failed to sustain momentum which led to a gradual slide toward $7.3B, reflecting unstable short-term activity.
Traders and analysts have placed some importance on the $500–$520 zone as the main resistance cluster. Additionally the $270–$300 area has remained a region where traders are watching for potential bounce attempts.
Even with the ZEC Zcash ETF filing, these levels have stayed central to how participants evaluate upcoming movement and short-term strategy.