Key Insights:
- BNB is approaching the golden pocket but has faced resistance on the 829–834 range which is shaping expectations of a short-term upward market direction.
- Intraday there was a controlled selling that led to forming lower highs and lower lows, as price attempted short-lived recovery movements.
- BNB Chain reported 4.4 million daily active users, $11.1 billion TVL, and strong weekly trading volume, indicating continued ecosystem engagement.
BNB is holding its support and has entered the week with careful market attention as traders assessed shifting price behavior, ecosystem activity, and user engagement. The latest technical readings and network data pointed to a market attempting to steady itself while participants monitored key levels.
Market Structure and Technical Signals
An analysis prepared by Umair Crypto noted that BNB pushed toward the golden pocket of its recent swing but could not break it. According to the chart illustration the price tapped the area briefly before slipping lower as buying interest faded.
The daily chart showed BNB reacting to a sharp sell-off from the 1100–1150 range and the analyst suggested that a close below the 829–834 zone may shape the next lower directional move.
After losing mid-range support, the asset drifted toward the 200-day moving average, where buyers attempted to hold the line. Price now trades just under the 0.618 retracement around 890–900, which has turned into a key resistance zone.
Momentum signals remained indecisive as volume stayed limited. The RSI recently moved through a descending trendline for the first time since September, though it still sits in neutral territory.
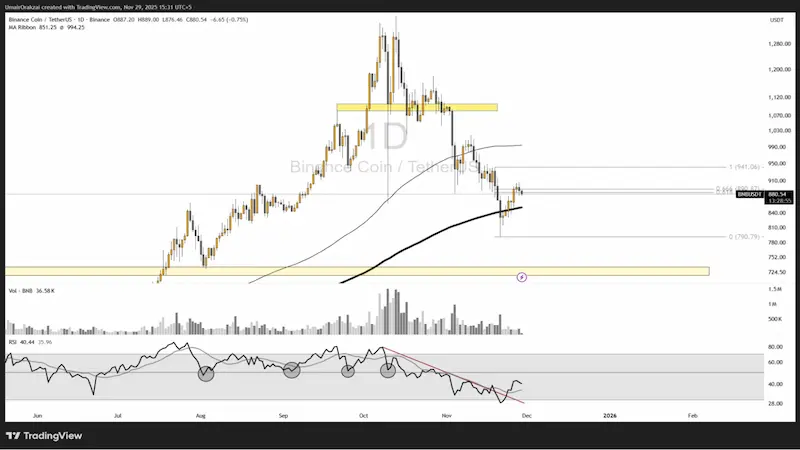 BNB 1 day Chart / Source: X
The market is in a wait and see mode to determine if BNB can reclaim resistance levels or will it slide toward the broader demand area between 725 and 760.
Short-Term Behavior and Intraday Pressure
Short-term charts highlighted an intensity of early selling as BNB dropped from just above 900. The decline stemmed from a broader market pressure and was not caused by an isolated movement.
A series of sharp swings formed shortly after, showing efforts to stage a recovery that lacked consistent strength. Throughout the period, price action shaped a line of lower highs and lower lows.
This pattern signals a controlled and a steady slide instead of a rushed exit from positions. Though intraday volume remained muted which is a sign of sellers gradually panic-driven behavior.
Toward the end of the session BNB attempted a small bounce, however this did not shift the day’s direction. Market observers are keen on how the asset handles itself in the nearby support levels and whether it could secure a firmer base.
Network Activity and Ecosystem Growth
BNB Chain recorded a strong engagement across its networks. Daily active users reached 4.4 million across BSC and opBNB, as both chains showed steady participation from DeFi users, gamers, and Web3 participants.
The near-even distribution indicated that interest was rising in BNB’s scaling environment. TVL climbed and reached $11.1 billion on November 26, a move that was supported by ongoing activity across major DeFi platforms.
Data from Defi Llama placed the BNB Chain among the largest ecosystems by TVL with Pancake Swap and Venus as the important contributors. This steady growth has ensured that these protocols have continued to attract capital and register consistent user activity.
In addition, the weekly trading volume total rose to $66.4 billion. This points to active movement and engagement across applications and exchanges and a reflection of persistent usage of the BNB chain and a market that continues to operate under measured but stable conditions.