Key Insights:
- XRP’s price is consolidated around $2.20 as MACD and RSI indicators show early bullish momentum hinting at a potential breakout.
- Exchange reserves have dropped from 3 billion to 2.7 billion XRP which is a reflection of consistent outflows and reduced sell-side pressure.
- XRP historical chart patterns resemble Ethereum’s 2016–2017 accumulation and are suggesting a strong macro uptrend if buying pressure increases.
XRP is delivering a very cautious recovery after undergoing a period of sideways consolidation. Ripples coin is currently moving around $2.20 and is showing potential bullish momentum in the short term. Market momentum indicators suggest that buyers are gradually returning, and this signals that a possible breakout is possible if volume strengthens. Technical indicators and supply trends will confirm renewed buying interest.
Market Structure and Short-Term Indicators
XRP is showing a tightening volatility and slightly rising lows that are followed by a multi-day pullback. Price has consolidated near $2.20 and is showing signs of stabilization and seems to be preparing for a potential breakout above the $2.23–$2.26 resistance zone.
However volume remains lower than previous surges which is suggesting that buyer activity is cautious and hesitant. Despite this, the MACD line has crossed above its signal line, and the red histogram bar has shrunk and begun turning positive.
This pattern is showing that bearish momentum is fading and bullish energy is emerging. Traders often consider a consistent MACD expansion as a confirmation of strengthening short-term trends.
The RSI reading is at 57.7 after rising from near-neutral levels. This bounce above the moving average signals an increase in buying pressure without it overextending into the overbought territory.
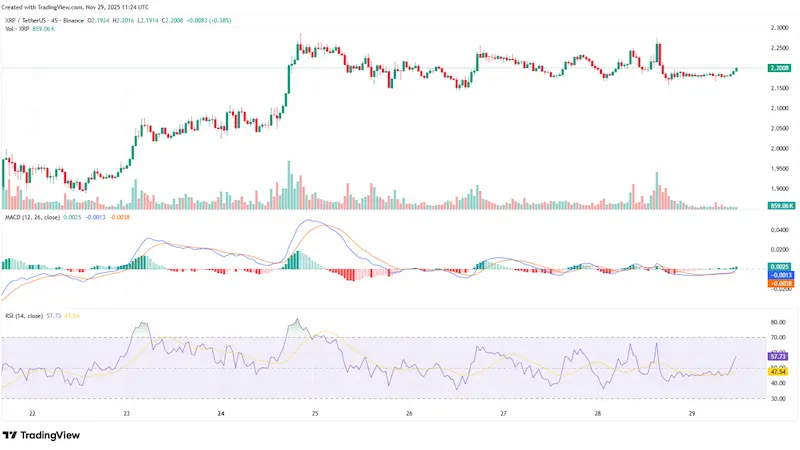 XRP 45 Mins Chart / Source: CryptoRank
This suggests that a decisive push above resistance could start a renewed bullish momentum and provide entry points for buyers that are in the market seeking to take profits.
Historical Comparison to Past Cycles
Popular market analyst Steph is crypto shared a visual comparison of XRP’s weekly chart to 2016–2017 structure. In both the cryptocurrency experienced prolonged consolidation followed by a sharp “spring” brief break that failed due to potential accumulation zones.
According to the analyst the final dip below its consolidation range was preceded by a strong upward rally that initiated a historic bull run. On the other hand, XRP’s chart exhibits similar repeated wicks that are testing lower boundaries which is a reflection of stabilization and potential exhaustion of sellers.
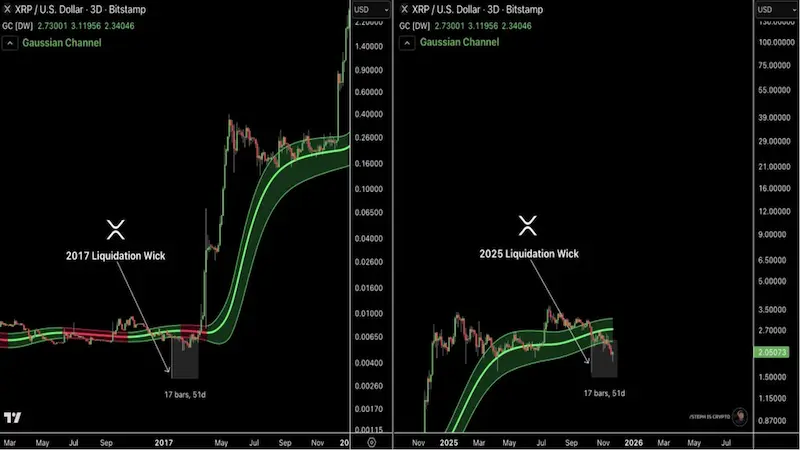 XRP Comparison Chart / Source: X
Although the chart patterns cannot accurately predict identical outcomes, the structural similarity emphasizes that a possible turning point is almost. Analysts further noted that XRP could be preparing for a macro move if buyers return decisively. This structure resembles Ethereum’s prior rally scenario that led to massive gains.
Exchange Reserves and Market Capitalization Trends
Looking at XRP’s exchange reserves they have decreased notably from roughly 3 billion in early October to about 2.7 billion by late November. This sustained outflow is suggesting that there is reduced sell-side pressure and this is pointing to a possible accumulation or strategic long-term positioning by larger holders.
The sharpest decline was recorded around October 6. This drop coincided with a brief price drop that was followed by a washout. Reserves then continued drifting downward as price stabilized between $2.00 and $2.40.
Market observers often consider simultaneous low reserves as a signal for an early bullish upward move. Recent market capitalization data shows that the total capital spiked above $136 billion, then was followed by a stabilization near $132 billion.
Trading volumes during this period remained consistent, indicating steady market activity. Then toward the end of the period, a modest upward push happened and this shows that there was renewed interest and cautious buying behavior in the market.