
Key Insights:
- Ethereum’s multi-month ETH/BTC chart shows a wedge nearing a breakout point as price tests descending resistance creating narrowing volatility across the structure.
- Exchange reserves fell from 25 million to 16.8 million ETH, an indication of sustained market withdrawals and a continued decline in liquidity levels.
- Ethereum continues to maintain its multi-year range as tightening volatility and recurring trendline rejections align with higher-timeframe breakout expectations from traders.
Ethereum has taken the center of trader discussions as its structure tightens and exchange reserves hit a record low. This buzz has created renewed interest across major trading pairs. Price action continues to compress across the high-timeframe range. As of November 28,2025, the price of Ethereum is $3,040.93 after an intraday gain of 2.49% which extended weekly gains to 10.95%.
Ethereum Shows Compressed Structure on ETH/BTC Chart
An analysis chart shared by MerlijnTrader on X presents the multi-month ETH/BTC structure showing a falling wedge that is approaching a breakout point. The pair has been forming lower highs and slightly lower lows as volatility continues to narrow.
In the recent charts, candles are bullish testing the upper boundary of the wedge.Analysts note that the pattern is a suggestion of reduced selling pressure and growing momentum.
If buyers maintain strength above the descending trendline chart projections point to a potential move toward the 0.036–0.037 BTC area. Such a scenario would reciprocate to a renewed relative strength from Ethereum.
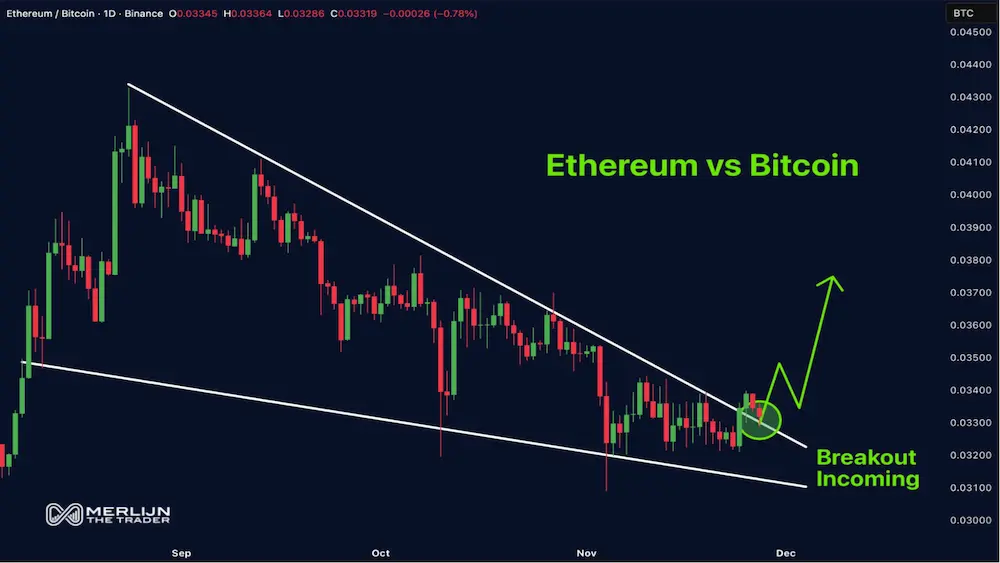 ETH/BTC Chart/ Source:X
On the flipside, the pattern leaves room for downside risk signaling that a move below support could push the pair toward 0.031 BTC. However, the chart signals a decisive period ahead as price action nears the apex of the structure.
Ethereum Exchange Reserves Fall to Multi-Year Lows
A second update from Merlijn Trader pointed to continued Ethereum exchange reserves drop, from above 25 million ETH to roughly 16.8 million ETH. The analyst pointed to a steady decline throughout recent years, with the most accelerated one witnessed in the last quarter of 2025.
This drop is the lowest level to have been recorded across major platforms. The fall in reserves suggest an increase in movement of ETH into long-term holding, staking, and self-custody.
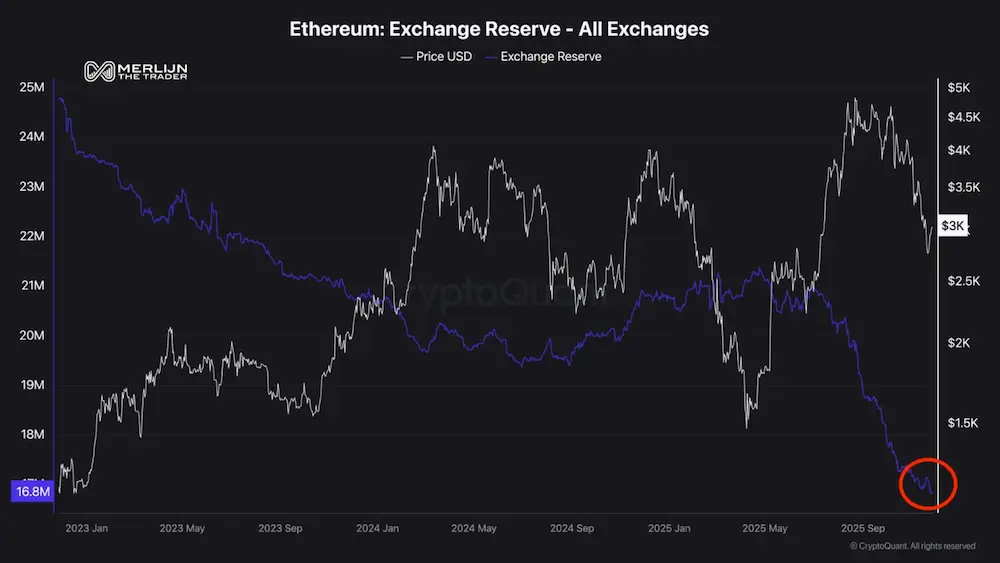 Ethereum Exchange Reserves/ Source:X
The trend persists regardless of short-term price shifts forming a structural reduction in liquid supply. Analysts have cautioned that such movements can shape future liquidity conditions.
In addition, the current price movements reflect broad swings, yet the reserve curve has remained consistently downward. This data therefore indicates that market participants continue to remove ETH from exchanges at a notable pace.
Ethereum Range Structure and Weekly Market Performance
ETH/BTC continued its consolidation within a major accumulation zone near 0.032–0.033. The area has proved to be a technical region where buyers have previously reacted. Therefore a move above the short-term moving average may cause a shift in momentum as deeper levels remain outlined below.
The multi-year range structure continues to face repeated rejections at a macro trendline. Volatility has tightened for more than three years, creating conditions that some traders have termed to be a preparation for a large-scale move.
The chart outlined targets aligning with the $8,500 to $9,000 region. Overall the whole crypto market is in a recovery mood. The weekly performance data shows XRP leading with a 17.5% gain.
Ethereum follows with a 13.7% rise, and Solana records 13.5%. These moves occur as intra-day charts for major assets display active but controlled volatility across key levels.