
Key Insights:
- Solana dominates tokenized stock trading with a 99% market share, boosting long-term network confidence despite mixed prices.
- Solana faces strong resistance near $141, with heavy holder activity creating a potential near-term price ceiling.
- ETF flows show mixed interest, as $8.1M exits 21Shares Solana ETF while other funds see inflows, keeping market activity steady.
Solana is drawing attention as traders watch its price test reach a critical range, while the network reaches a record share in tokenized stock activity. The sharp rise in its role in real-world asset markets has also placed the asset at a key point for future price direction.
Solana’s Growing Share in Tokenized Stock Activity
Solana reached a record 99% share of tokenized stock trading in October, and this took shape after four months of steady gains. Data from platforms such as xStocks and Dinari showed heavy activity on Solana due to fast transactions and low costs, and this wider usage supported interest in the network even during market swings.
This trend also shifted the competitive field, as Solana moved ahead of earlier leaders such as Avalanche. Firms working in real-world asset tokenization increased their use of the chain, and this created more market attention as global forecasts projected strong growth for the sector. Market watchers noted that this rise in activity improved long-term confidence in the chain even as short-term price moves stayed mixed.
Solana Price Faces Tight Resistance Zone
Solana traded near $141 on November 28, 2025, and charts showed tight resistance under the 150-dollar level. Ali Charts, a market analyst, shared a cost basis distribution chart on X that showed about 13M Solana bought near $142. The chart suggested that many holders who bought at that price might sell if the asset tested that zone, which created a ceiling for the near term.
Ali also shared a chart showing the net unrealized profit and loss for Solana. The chart showed values below zero, and this suggested that many holders were at an unrealized loss. The trader said this showed recent capitulation, and this occurred during a wider market drop that sent Bitcoin near $80,000 two weeks ago. This period also brought record outflows from Bitcoin and Ethereum spot ETFs.
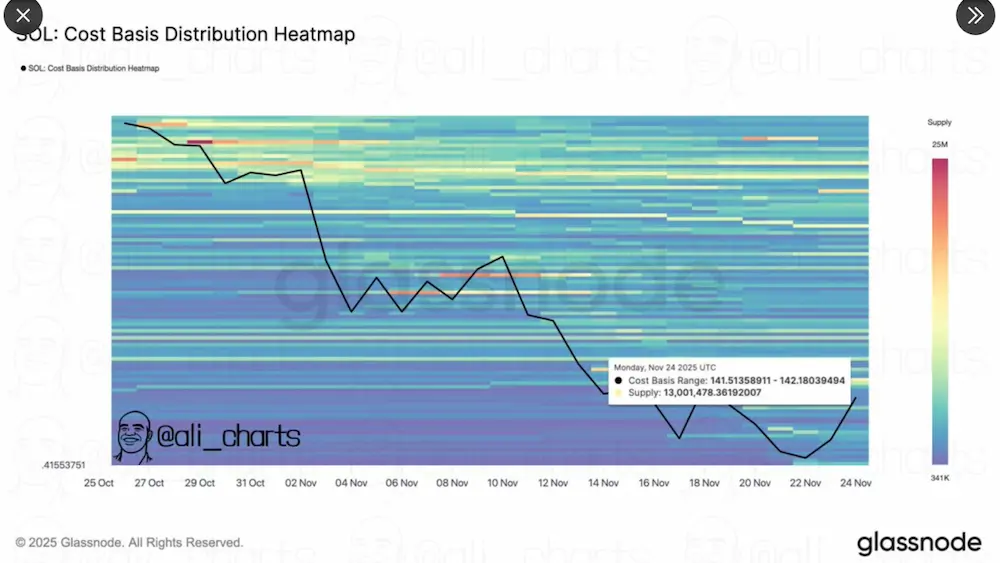
Solana Cost Basis Distribution Heatmap | Source: X
Another trader on X, known as DevKhabib, said the failure to move past $141 showed weak retail demand. The trader said institutions were shaping the market and suggested a possible move toward $125. At the same time, a commentator known as GordonGecko said a break above $141 could bring a run toward $200. These views reflected the divided outlook as Solana moved near a key point.
https://x.com/DevKhabib/status/1993656860529119651?s=20
Market Context and ETF Activity
ETF flows added another layer to the situation. The 21Shares Solana ETF marked the first net outflow among SOL spot ETFs, with $8.1 million leaving the product. Other funds from Bitwise, Grayscale, and Fidelity recorded inflows, and this kept overall activity steady.
Franklin also filed for a new Solana ETF with the ticker SOEZ, and this increased competition among issuers. Analysts watched these flows carefully because recent shifts came just as Bitcoin moved back above $90,000. The crypto market now looks toward the December policy decisions from the Federal Reserve and the Bank of Japan, and both events may shape trading patterns across major assets.