Key Insights:
- Dogecoin’s $0.0796 cluster holds 18.21% of supply and is acting as a major pivot and most investors are mostly in profit.
- Charts have mapped ascending trendlines and demand zones near $0.15 which are signaling a potential bullish continuation for DOGE.
- Long-term on-chain data shows DOGE consolidating between mid-range valuation bands projecting a structured growth and stable investor conviction.
Dogecoin has shown stability around critical support zones.This is giving signs of a potential bullish movement opportunities.Market data and on-chain insights are providing a clear bullish tone on price behavior and investor concentration.
Dogecoin UTXO Realized Price Distribution
The UTXO Realized Price Distribution (URPD) for Dogecoin is a chart that reveals where holders last acquired their $DOGE. The chart has indicated several illustrated zones of concentrated cost basis.
An analysis chart from Ali_charts indicates $0.080 as key support and $0.20 serving as the main resistance.The analysis also identified another prominent cluster around $0.0796.
This is where over 27.6 billion DOGE, almost 18.21% of the supply, were last transacted. The coin is trading above this level and has placed many investors in profit and has reduced immediate sell pressure.
Analysts however have warned that falling below it could make the zone a resistance point. This is because holders must aim to break even.Additional clusters appear around $0.202 and $0.208 and roughly 8% of supply Dogecoins were transacted in this zone.
https://x.com/ali_charts/status/1994005028344864864?s=20
These levels may act as profit-taking zones in future rallies and end up slowing upward momentum. Concurently, smaller but notable pockets are spread across $0.05–$0.18.
This is reflecting the fragmented cost basis typical of meme-driven cryptocurrencies.The URPD highlights that DOGE’s market structure is concentrated around a few critical price levels that are helping map future support and resistance.
Weekly and Short-Term Price Structure
On the weekly charts Dogecoin reacted near a major demand zone around $0.15. Red candles show consistent seller pressure, however, stabilization and upward wicks suggest that buyers are defending this level.
This zone has acted as a springboard for upward price movement in the past.Technical indicators have shifted to a neutral stance, the RSI is hovering around 40–45 showing reduced momentum but is not yet in the oversold zone.
Lower momentum oscillators often hint at a possible bullish cross, though volume is crucial before any confirmation is made. According to predictions, supply zones overhead between $0.28 and $0.32, may limit upward progress.
 Source:Atom Via X
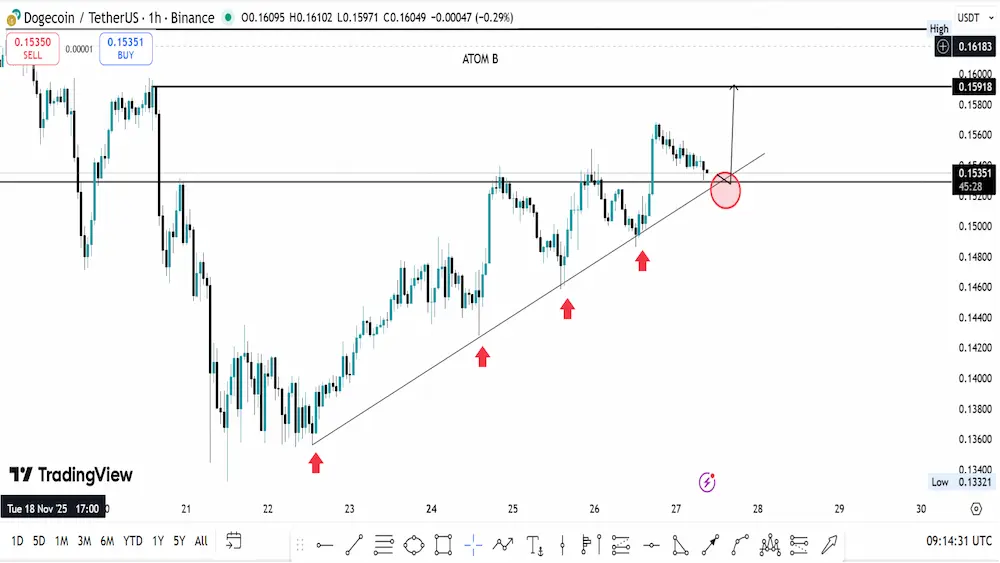
Therefore bulls need to convincingly reclaim lower resistance levels.The 1-hour chart shows an ascending trendline that has been consistently respected.
The structure has formed higher lows and is showing steady buying pressure. Price is approaching this trendline and is around a short term pivot zone near $0.153–$0.154.
If Dogecoin successfully bounces at this key level, it could climb toward $0.159–$0.160, while a breakdown might push it down to $0.148–$0.150.
Long-Term On-Chain Dynamics
Dogecoin’s on-chain price patterns have compression phases between lower and mid-range bands, often followed by strong upward moves.
The prior rallies pushed toward red top bands and DOGE has maintained higher structural ranges starting from late 2021. This is reflecting a rise in realized cost bases and long-term holder conviction.
Price has consistently remained above prior cycles’ lower bounds which is an indication of sustained market maturity. Dogecoin is showing balanced market conditions and historical on-chain patterns indicate that these consolidation periods often precede directional moves.
Combined with the bullish trendlines and URPD clusters data they point to a potential bullish roadmap, as traders watch for a rally to resistance zones.