Key Insights
- Bitcoin continues to advance within a descending structure, with analysts watching the $90K–$92K zone and the upper trendline near $100K for trend clarity.
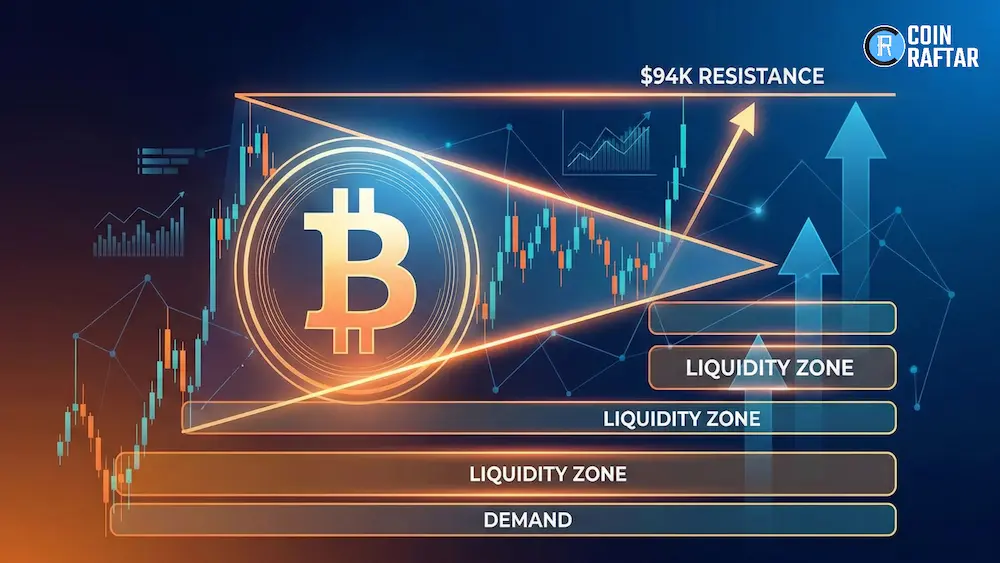
- Daily charts locate demand zones between $81K–$83K and supply zones around $95K–$98K, these are pivotal barriers to be broken before any move toward $100K.
- Liquidity heatmaps locate dense short clusters near $90K–$92K and $95K–$100K, as upward pressure and active exchange withdrawal trends surge.
Bitcoin is in a volatile structure as market data shows a steady interest from buyers after a recent rebound. Next resistance levels continue to draw attention from traders.
Descending Structure and Short-Term Price Reaction
Market analyst Captain Faibik noted that Bitcoin is shaping a descending broadening wedge on the 4-hour chart.The analysis shows the price bouncing cleanly off the lower trendline. This reaction at the bottom of the pattern hints that sellers may be losing momentum.
According to the analysts Bitcoin could revisit the $90,000–$92,000 zone before making another attempt toward the upper boundary of the formation. Trendline resistance near $100,000–$102,000 has capped rallies for weeks.
Therefore reclaiming those levels is a key requirement for continued bullish momentum. Faibik noted that a push above $100,000 could open the door for stronger December movement if buyers sustain the positive pressure.
https://x.com/CryptoFaibik/status/1993910408655360222?s=20
Traders continue to watch volume and candle behavior near resistance zones for this will be an indicator that the price is ready to break the upper trendline.Current movement reflects early strength but still sits within a controlled range.The pattern remains intact, and each approach toward the top boundary has created hesitation.
Daily Structure and Layered Supply Zones
Bitcoin is pushing above $89,000 and moving toward the $93,000–$94,000 resistance area. Trader TedPillows explained that if buyers manage to reclaim this zone, the price could make a move toward $100,000.
However the analyst cautioned that a rejection might send it back toward $88,000.A chart analysis also highlights a strong demand area between $81,000 and $83,000.
This is an area which recently sparked a sharp rebound after a deeper drop. Furthermore, the chart shows several stacked supply zones, with the $95,000–$98,000 range standing out as a major barrier that has capped any upward attempts.
Recent breakdowns originated there, creating a cluster of lower highs and forming a notable area of stored liquidity. That zone aligns with a well-defined horizontal level that traders now monitor closely.
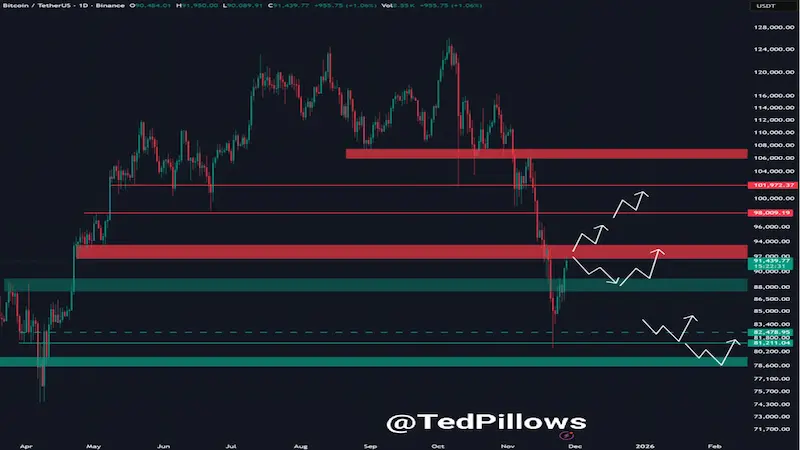 Source:TedPillows
Possible pathways show either a shallow retracement into the mid-$90,000 area or a deeper test of $90,000–$92,000 before any attempt at higher levels. A drop below the main demand zone could open room toward $78,000–$80,000, although recent movement maintains a constructive upward shape.
Liquidity Heatmap, Intraday Flow, and Exchange Activity
Coinglass liquidation heatmap identified a dense cluster between $90,000 and $92,000 showing heavy short exposure above current levels. Movement into those bands could fuel volatility if forced buy-backs trigger rapid swings.
Higher pockets near $95,000–$100,000 remain the strongest liquidity targets that are forming potential paths for a squeeze.Intraday trading data shows a rally from the mid-$86,000 region to above $92,000, followed by a consolidation.
In the past 24 hours the market traded mostly between $91,000 and $92,000 for much of the day. Then it edged back toward $91,000 as momentum cooled. The movement showed steady buyer interest and each small dip was quickly absorbed by the market.
Subsequently, the total crypto market cap rose from about $1.65 trillion to more than $1.8 trillion. It closed the period with a strong upswing indicating that there was renewed activity after recent volatility.