

Key Insights:
- Dogecoin’s heatmap reveals a dense resistance zone near $0.21,over 10 billion tokens were accumulated during repeated interactions with this zone.
- Short-term trading shows a quick spike toward $0.206 followed by a steady decline, meaning that sellers controlled rebounds and volume consistently.
- Market cap moved consistently with price movement, it rose above $31B before retracing starting a cooling period marked by weaker upward follow-through.
Dogecoin is consolidated within a narrow zone as new on-chain activity and market behavior point to waning bull momentum. Across the past several sessions analysts have been watching clustered cost-basis levels to see if they may guide the next move.
DogeCoin Cost-Basis Clusters Shape Current Trading Setup
Market analyst Ali Charts shared a post on X that referenced a dense concentration of about 10.5 billion DOGE around the $0.21 level. This cluster appears on the cost-basis distribution heatmap as a bright, horizontal band.
The zone proved to be a substantial resistance as many wallets accumulated tokens within this price area. Further more, price movement from mid-September to mid-October frequently tested these layered cost bands.
These interactions around the $0.20–$0.21 range zones indicate that it is an area where holder interest increased. Especially because each pullback through the upper cluster showed weakening follow-through as short-term holders adjusted their positions.
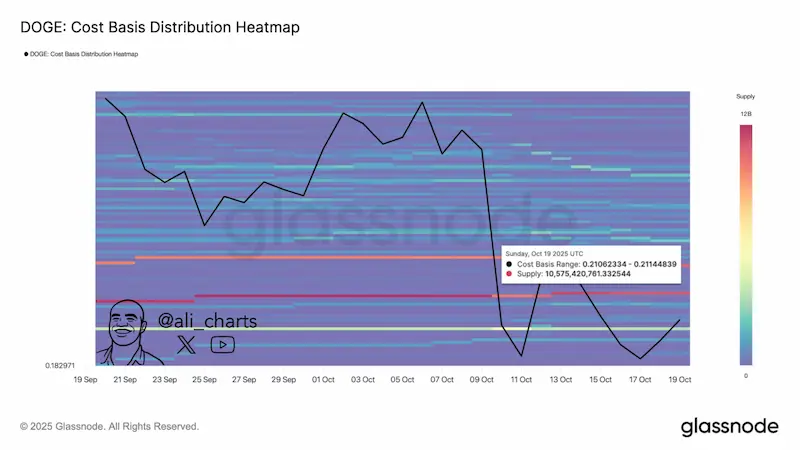
Source : Ali Charts Via X
The heatmap also shows repeated failed recoveries as price met steady supply overhead. Market behaviour in this region suggests that traders continue to monitor these shelves while waiting for clearer direction.
Short-Term Chart Shows Pressure Building
Across a recent 48-hour period, Dogecoin briefly moved toward $0.205–$0.206 before entering a progressive decline. The session began near $0.198–$0.20, with a short dip toward $0.192 before midday stabilization offered limited support.
The upward spike later that day reflected a quick rise in speculative demand. However, momentum faded quickly, and the token slipped below $0.195 as sellers controlled
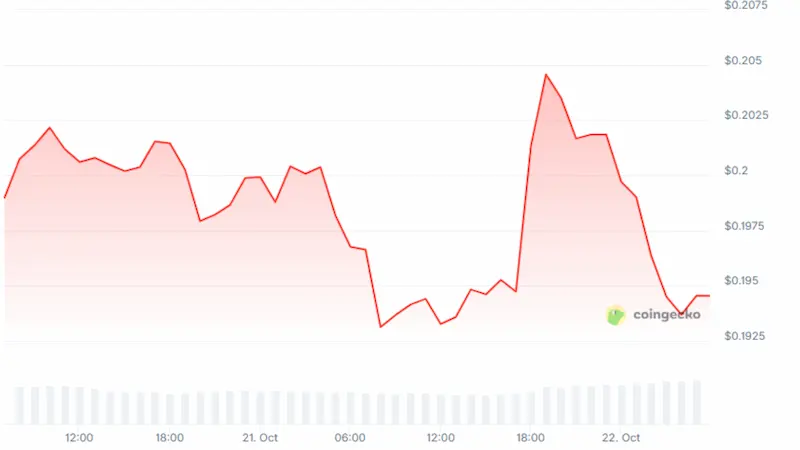
Source : CoinGecko
Each rebound weakened as trading continued through early October 22.By the end of the period, the price hovered near $0.188–$0.19, where trading quieted and volume remained mild. This structure is signalling that the market is waiting for renewed activity rather than reacting to elevated volatility.
Market Capitalization Mirrors Slow Cooling
Market capitalization moved mostly between $29.5B–$30.5B early in the cycle. Movements aligned with price behaviour, showing light fluctuations without strong directional strength. During mid day it slid toward $29B showing mild selling before a sharp afternoon rise.
The brief surge took market capitalization above $31B, reflecting a short burst of activity. That rise reversed overnight, with value falling back toward $29B as fast-moving traders exited positions.
The move erased most of the earlier gains. A separate trend chart showed two correlated lines moving lower from October 20–22. Both series recorded consistent downward pressure, capturing a cooling phase across the period.


Really Appreciate this blog post, how can I make is so that I get an email sent to me when you make a fresh post?
thanks